
NOAA’s Global Monitoring Laboratory supports the nation’s greenhouse gas monitoring strategy
2023-11-29
This week, the Biden-Harris Administration released a conceptual framework for a national system to measure, monitor, and share information related to reducing greenhouse gas emissions in order to meet U.S. commitments under the 2015 Paris Agreement.
Led by the White House Office of Management and Budget, Office of Science and Technology Policy, and Climate Policy Office, the new U.S. Greenhouse Gas Measurement, Monitoring, and Information System strategy builds on a wide array of cooperative research, data products, activities and capabilities aimed at understanding emissions, removals, and sinks of greenhouse gases (GHGs) from national to regional and urban scales as well as from a range of sources.
NOAA will commit its long-established, state-of-the-art capabilities in observation, modeling, and data analysis—including several major initiatives from NOAA’s Global Monitoring Laboratory (GML)—to support this whole-government effort.
GML has more than 50 years of experience monitoring atmospheric levels of greenhouse gases, including measurements of carbon dioxide and other GHGs at a globally distributed network of air sampling sites. These sites comprise the laboratory’s Global Greenhouse Gas Reference Network, which includes NOAA’s atmospheric baseline observatories as well as ground-based, tower-based, and airborne measurement sites. GML’s capabilities also include the modeling and data assimilation systems, Carbon Tracker and Carbon Tracker Methane, and data products such as the Annual Greenhouse Gas Index.
NOAA atmospheric baseline observatories
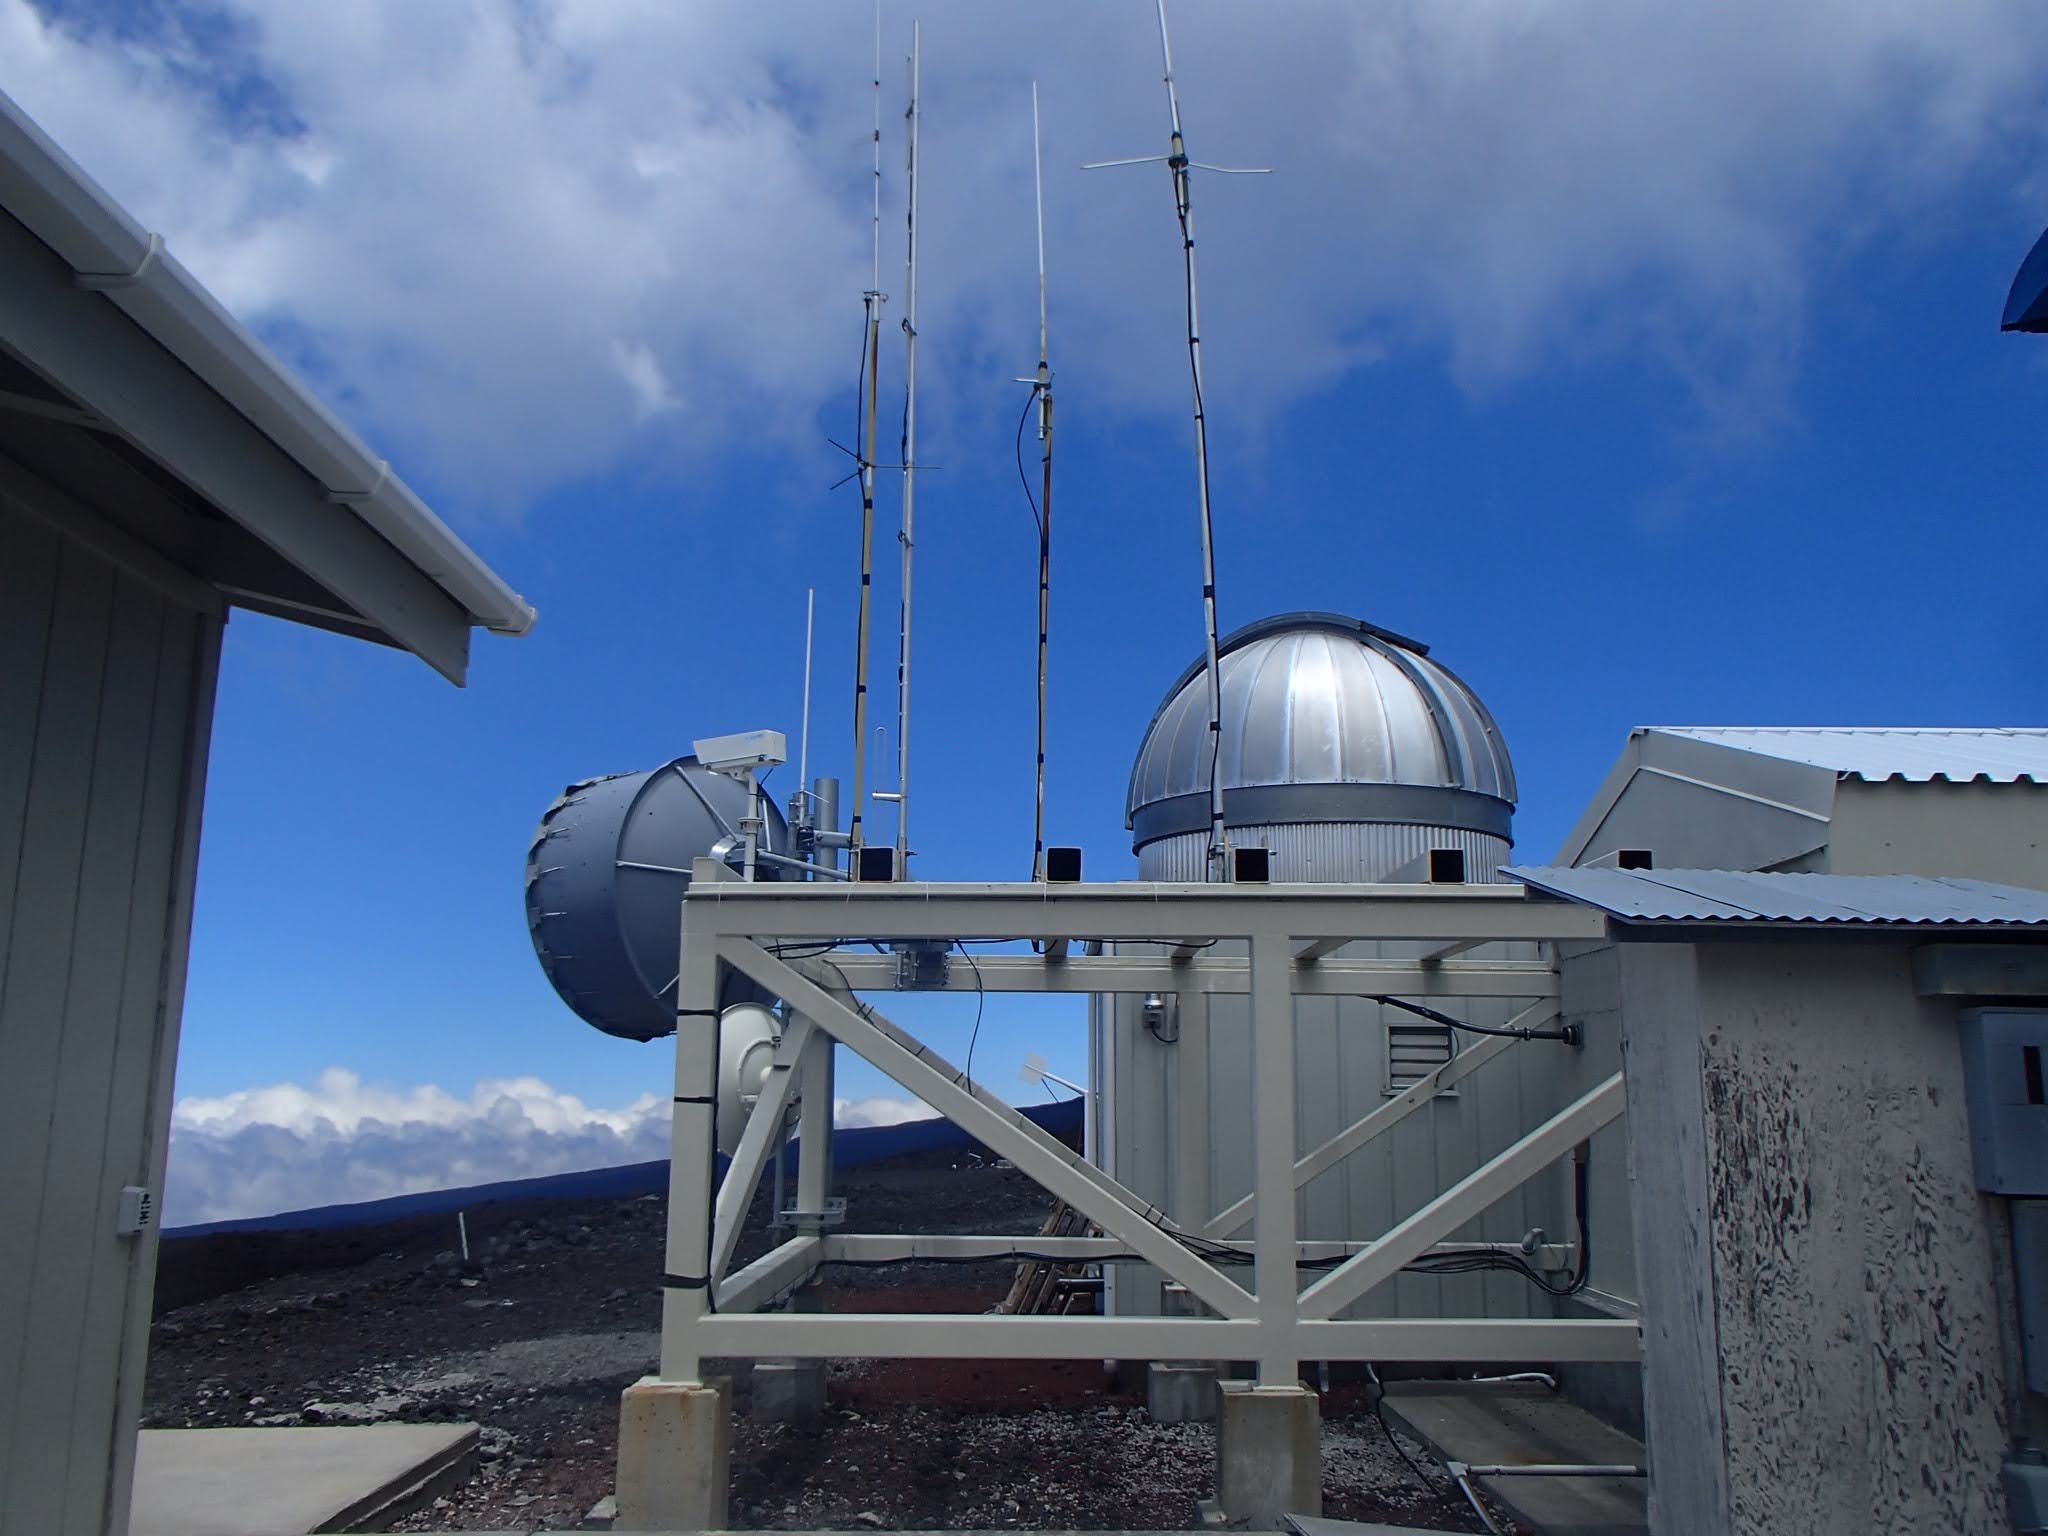
GML operates the four NOAA atmospheric baseline observatories: Mauna Loa Observatory in Hawaii; Barrow Observatory in Utqiaġvik (formerly Barrow), Alaska; American Samoa Observatory; and South Pole Observatory in Antarctica.
The Mauna Loa Observatory (MLO) is considered the premier site for measuring greenhouse gases in the northern hemisphere. Scientists there have been continuously monitoring and collecting data related to atmospheric change since the 1950s, when increasing atmospheric concentrations of carbon dioxide were first documented at MLO. Atmospheric composition change data from MLO is reported to Congress under mandate and used in global climate assessments.
The Barrow Observatory is NOAA’s northern-most atmospheric baseline observatory and the longest continuously operating atmospheric climate observatory in the Arctic. Carbon dioxide measurements at Barrow began 50 years ago, in July 1973. Since its establishment, the Barrow Observatory has played an important role in Arctic research, providing long-term observations of atmospheric composition as it relates to climate change, ozone depletion, and air quality.
Together, the four baseline observatories create a pole-to-pole transect through the remote Pacific to enable tracking of global distributions and trends in clean air minimally impacted by local contamination.
The Global Greenhouse Gas Reference Network
GML’s Global Greenhouse Gas Reference Network (GGGRN) provides extremely precise measurements of carbon dioxide, methane, nitrous oxide, and many other GHGs, and transport modeling to identify their sources and sinks. Many GGGRN records began in the 1970s.
The GGGRN network of 75 sites worldwide includes the four baseline observatories, as well as tall towers, aircraft, and surface sites, which provide research-quality, sustained greenhouse gas observations directly traceable to internationally recognized standards.
GGGRN data are essential for understanding ecosystem responses to carbon emissions and climate change over timescales of decades to centuries. GML scientists investigate vulnerable carbon reservoirs and carbon-climate feedbacks, including tracking emissions from permafrost release in the Arctic and monitoring uptake from tropical forests in the Amazon. They also use these data to better understand U.S. emissions and uptake within a global context.
Recent findings from the network include:
-
Carbon dioxide is responsible for 66 percent of the climate forcing by all greenhouse gases
-
Record-high annual global methane increases were recorded in 2020, 2021 and 2022
National Observations of Greenhouse gases Aircraft Profiles
The National Observations of Greenhouse gases Aircraft Profiles (NOGAP) survey recently completed the first of six circuits around the United States to document and understand in great detail the vertical distribution of GHGs in the lower atmosphere. The NOGAP survey supplements ongoing GGGRN aircraft-based sampling.
This effort is part of a newly funded NOAA program focused on enhancing observations and analysis of GHGs from global-to-regional scales. Initiated in FY 2022, the program addresses coverage gaps in NOAA’s global- and U.S.-based observations, modernizes GHG measurement systems, and expands NOAA’s ability to detect changes in ecosystems and human activities that contribute to the accumulation of GHGs in the atmosphere.
Well-calibrated global atmospheric greenhouse gas measurements
Carbon dioxide and methane are measured continuously at the baseline observatories and at tall-tower and high altitude monitoring stations across the United States. Additionally, air samples collected weekly from the GGGRN Cooperative Air Sampling Network are returned to Boulder for analysis. There, laboratory researchers analyze the air samples for a comprehensive suite of greenhouse gases, ozone-depleting substances, and related species that provide information about specific sources and processes. For example, carbon monoxide is an indicator of incomplete combustion such as from wildfires , and radiocarbon (14C) provides a unique signature for tracking fossil fuel emissions.
GML serves as the World Meteorological Organization’s Central Calibration Laboratory for carbon dioxide, methane, nitrous oxide, sulfur hexafluoride, and carbon monoxide. GML also calibrates compressed gas standards for ozone-depleting substances and their replacements, such as CFCs and HCFCs, as well as stable isotopes of carbon dioxide through a collaboration with the University of Colorado Boulder.
Carbon Tracker
GML’s Carbon Tracker is a carbon dioxide measurement and modeling system that tracks global sources (emissions to the atmosphere) and sinks (removal from the atmosphere) of carbon dioxide. CarbonTracker uses atmospheric carbon dioxide observations from many collaborators and simulated atmospheric transport to estimate surface fluxes of carbon dioxide.
The current release of CarbonTracker, CT2022, provides global estimates of surface-atmosphere fluxes of carbon dioxide from January 2000 through December 2020. Policy makers, industry, scientists, and the public can use CarbonTracker to inform decisions about limiting greenhouse gas levels in the atmosphere.
In October, GML scientists released NOAA’s latest CarbonTracker product. CarbonTracker-CH4 2023 provides estimates of global-scale methane emissions consistent with observed patterns of methane and its stable isotope, 13CH4 . Using both sets of observations, the researchers can separately estimate fossil fuel and microbial emissions of methane. Microbial sources include emissions from wetlands and anthropogenic emissions associated with agriculture and waste management.
The new emissions estimates provided insight into the causes of long-term methane growth and recent record-high global methane growth. In a long-term analysis (2006-2021), the researchers observed a significant increase in microbial emissions. The researchers also found that the 2020-2021 increase in atmospheric methane was primarily caused by a large increase in microbial sources rather than fossil fuels.
Annual Greenhouse Gas Index
NOAA’s Annual Greenhouse Gas Index, known as the AGGI, tracks increases in the warming influence of heat-trapping gases generated by human activity, including carbon dioxide, methane, nitrous oxide, chlorofluorocarbons, and 15 other gases. According to the most recent annual report, greenhouse gas pollution from human activity trapped 49 percent more heat in the atmosphere during 2022 than those same gases did in 1990.
Read more from NOAA about the new U.S. Greenhouse Gas Measurement, Monitoring, and Information System strategy here.