
The NOAA Ozone Depleting Gas Index:
Guiding Recovery of the Ozone Layer
NOAA Gloabl Monitoring Laboratory, R/GML, 325 Broadway, Boulder, CO 80305-3328
Stephen.A.Montzka@noaa.gov,
Geoff.Dutton@noaa.gov
and Isaac.Vimont@noaa.gov
The stratospheric ozone layer, through absorption of solar ultraviolet radiation, protects all biological systems on Earth. In response to concerns over the depletion of the global ozone layer, the Clean Air Act, as amended in 1990, mandates NASA and NOAA to monitor stratospheric ozone and ozone-depleting substances (ODSs).
SEC. 603. MONITORING AND REPORTING REQUIREMENTS
(d) Monitoring and Reporting to Congress
(2) The Administrators of the National Aeronautics and Space Administration and the National Oceanic and Atmospheric Administration shall monitor, and not less often than every 3 years following enactment of the Clean Air Act Amendments of 1990, submit a report to Congress on the current average tropospheric concentration of chlorine and bromine and on the level of stratospheric ozone depletion. Such reports shall include updated projections of -
(A) peak chlorine loading;
(B) the rate at which the atmospheric abundance of chlorine is projected to decrease after the year 2000; and
(C) the date by which the atmospheric abundance of chlorine is projected to return to a level of two parts per billion
This information is critical for assessing if the international Montreal Protocol on Substances that Deplete the Ozone Layer is having its intended effect of mitigating increases in harmful ultraviolet radiation. In order to provide the information necessary to satisfy this congressional mandate, both NASA and NOAA have instituted and maintained global monitoring programs to keep track of ozone-depleting gases as well as ozone itself.
While data collected for the past 40 years have been used extensively in international assessments of ozone layer depletion science, the language of scientists often eludes the average citizen who has a considerable interest in the health of Earth’s protective ultraviolet radiation shield. Are the ozone-destroying chemicals declining in the lower atmosphere and stratosphere? When do we expect the ozone hole above Antarctica to disappear? Will the timing of recovery be different for the ozone layer above mid-latitudes? In order to more readily convery the answers to these questions, NOAA has developed an index, the Ozone Depleting Gas Index (ODGI).
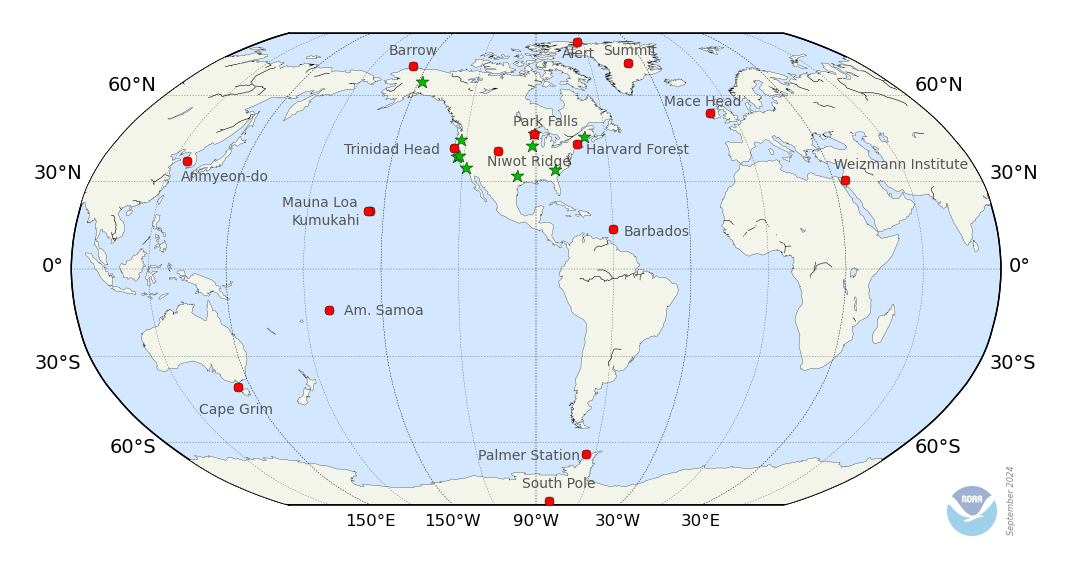
This index is derived from NOAA’s measurements of chemicals that contain chlorine and bromine at multiple remote surface sites across the planet (see the map in Figure 1). It is defined as 100 at the peak in ozone depleting halogen abundance as determined by NOAA observations, and zero for the 1980 abundance, which corresponds to when recovery of the ozone layer might be expected based on observations in the past, all other things being constant.
Two different indices are calculated, one that is relevant for the ozone layer over Antarctica (the ODGI-A), and one that is relevant for the ozone layer at mid-latitudes (the ODGI-ML). While both indices are derived from NOAA measurements of halocarbon abundances at Earth’s surface, separate indices for these different stratospheric regions are provided to account for the unique nature of the Antarctic stratosphere compared to the stratosphere at mid-latitudes in both hemispheres. Though an index for the Arctic stratosphere is not explicitly calculated here, it is likely that its value would lie between the mid-latitude and Antarctic ODGI in any given year.
Note that the methodology used in this 2024 update to NOAA’s Ozone-Depleting Gas Index (ODGI) remains the same as in previous updates occurring after 2011.
Observations of Ozone Depleting Gases
The ODGI is estimated directly from observations at Earth’s surface of the most abundant long-lived, chlorine and bromine containing chemicals whose production and consumption is controlled by the Montreal Protocol (15 individual chemicals). These ongoing, surface-based observations provide a direct measure of nearly all of the chlorine and bromine atoms in the lower atmosphere, or troposphere, contained in chemicals with lifetimes longer than approximately 0.5 yr. Because the lower atmosphere is quite well-mixed, these observations also provide an accurate estimate of the amount of chlorine and bromine entering the stratosphere from these chemicals. The threat to stratospheric ozone from ODSs, however, is derived only after considering additional factors: the time it takes for air to be transported from the troposphere to different regions of the stratosphere, air mixing processes during that transport, and chemical specific rates at which ODSs photolytically degrade and liberate reactive forms of chlorine and bromine while in the stratosphere.
In calculating the 2024 ODGI, photochemical degradation rates of ODSs specific to the stratospheric region of interest are used (based on Schauffler et al., 2003, see also Newman et al., 2007). Those degradation rates depend upon the length of time air in the stratosphere has been isolated from the troposphere (its “mean age”), which is about 3 years in the mid-latitude stratosphere and about 5.5 years for the Antarctic stratosphere). Furthermore, the efficiency of inorganic bromine in depleting ozone relative to chlorine is taken to be 60 to 65 times larger than chlorine. When these factors are considered in combination with measured global mean abundances in the lower troposphere, a quantity called Equivalent Effective Stratospheric Chlorine (EESC) is derived, and the ODGI is based on this metric. Note that we have not incorporated the updated formulation of EESC suggested by Engel et al. (2018). This revision would not substantially change the ODGI for Antarctica but would suggest less progress towards recovery in mid-latitudes than indicated here. Incorporation of this additional refinement is planned for 2025.
Because transport-related time lags are explicitly included in the calculation of EESC, the ODGI provides a measure of changes in the present-day stratosphere, as opposed to being an estimate of tropospheric changes relevant for the stratosphere three to six years in the future, as was done in earlier (pre-2012) versions of the ODGI.
As mentioned above, the ODGI is calculated for two different stratospheric regions: mid-latitudes and the Antarctic. Different trends in EESC are observed in these regions because of differences in transport and chemistry. The ODGI in the Antarctic stratospheric (ODGI-A) is derived from values of EESC in the Antarctic stratosphere (EESC-A), and the ODGI in the mid-latitude stratospheric (ODGI-ML) is derived from values of EESC in the mid-latitude stratosphere (EESC-ML).
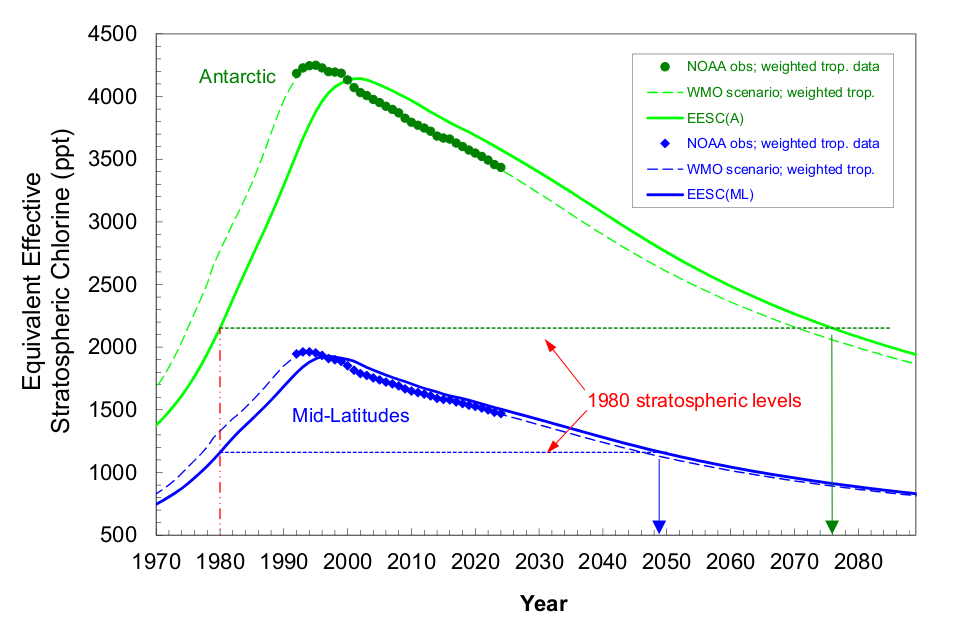
Air reaching the Antarctic stratosphere during springtime has been isolated from the troposphere for 5 to 6 years on average, so nearly all of the halocarbons in this air have degraded to inorganic forms that are potential ozone-depleting agents. As a result, EESC values (EESC-A) are higher over Antarctica (Figure 2). Furthermore, progress has been slower in reducing EESC-A back to 1980 values compared to EESC-ML in mid-latitudes because the most recent tropospheric changes have yet to reach the Antarctic stratosphere (Figure 3). Antarctic changes in EESC-A are also delayed because of mixing processes.
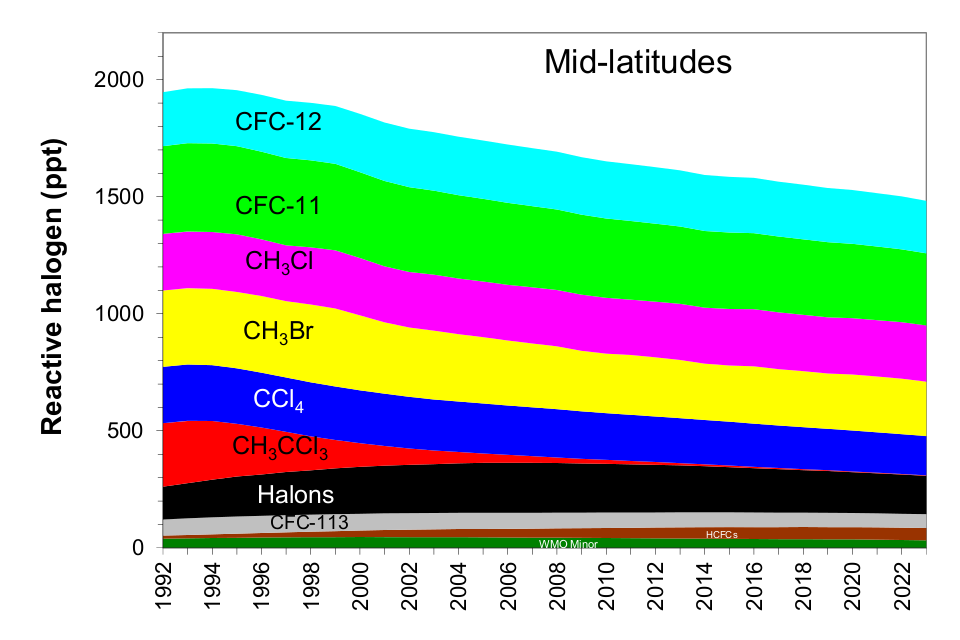
The concentration of reactive halogen in the mid-latitude stratosphere (EESC-ML) is generally smaller than in the Antarctic stratosphere because halocarbons have had less time to become degraded by high-energy solar radiation in the younger mid-latitude stratosphere (the mean age of mid-latitude stratospheric air is ~3 years) . In addition, EESC-ML values have decreased relatively closer to 1980 levels primarily because they more closely track tropospheric trends given the shorter transport times for moving air from the troposphere to mid-latitude stratosphere. Another factor contributing to the larger relative decrease in EESC-ML arises because reactive halogen levels in mid-latitudes are more sensitive to changes observed for shorter-lived chemicals that have decreased quite rapidly in the lower atmosphere during the past two decades (e.g., CH3CCl3, CH3Br).
Click on image to view full size figure.
The Ozone Depleting Gas Index (ODGI)
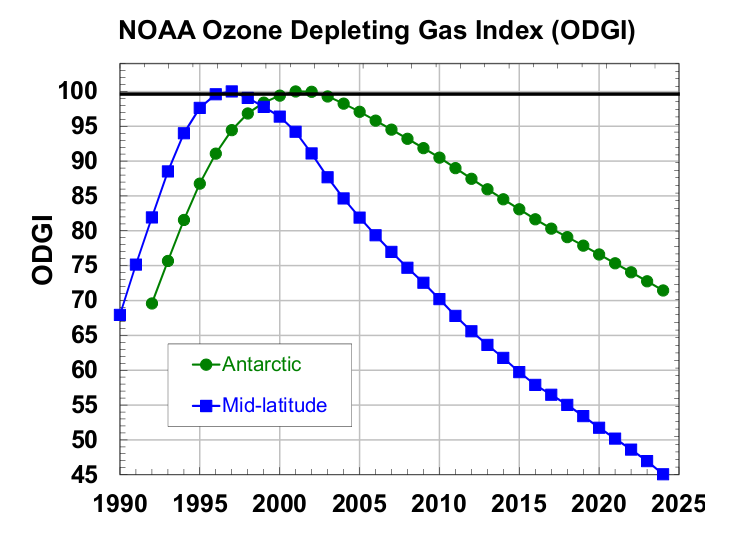
The ODGI-A is defined by the observed decline in halogen abundance (as EESC-A) from its peak in Antarctica (ODGI = 100) relative to the drop needed for EESC-A to reach its value in 1980, which is about when the Antarctic ozone hole was readily detected (Figure 2, dotted green line). Although some halogen-catalyzed ozone depletion was occurring before 1980, return of EESC-A back to the 1980 level would represent a significant milestone for the Montreal Protocol (Figure 2). On the ODGI scale, the value of ODGI-A at the beginning of 2024 was 72 (71.6) i.e., by that time reactive halogen concentrations in the Antarctic springtime stratosphere had decreased 28% (i.e., 100-71.6) from their peak relative to the 1980 benchmark halogen value (Figure 3, green line and points). Reactive halogen concentrations in the Antarctic springtime stratosphere are projected to decline to that 1980 value sometime around 2070 considering the updated future scenarios in the 2022 WMO/UNEP Scientific Assessments of Ozone Depletion (Danial and Reimann et al., 2022) (see Figure 2).
Similar to ODGI-A, the ODGI-ML is defined as 100 at the peak in EESC-ML, and zero at the 1980 benchmark EESC-ML level, corresponding to when substantial ozone-layer recovery might be expected in the mid-latitude stratosphere if all other factors were to remain constant. Based upon reactive halogen abundances inferred for the mid-latitude stratosphere in 1980, we expect this recovery level to occur as EESC-ML drops below approximately 1200 ppt EESC (Figure 2, dotted blue line). On this scale, the 2024 value of the ODGI-ML was 45, i.e., by that time reactive halogen concentrations in the mid-latitude stratosphere had decreased 55% (i.e. 100-45.3) from their peak relative to the 1980 benchmark value, which would allow a near-normal ozone layer in mid-latitudes, all other factors being constant (Figure 3). Reactive halogen concentrations in the mid-latitude stratospheric are projected to decline to that 1980 value sometime around 2045 (Daniel and Reimann et al., 2022) (see Figure 2). Past changes in ODGI-A and ODGI-ML are displayed in Figure 3.
Click on image to view full size figure.
Click on image to view full size figure.
Click on image to view full size figure.
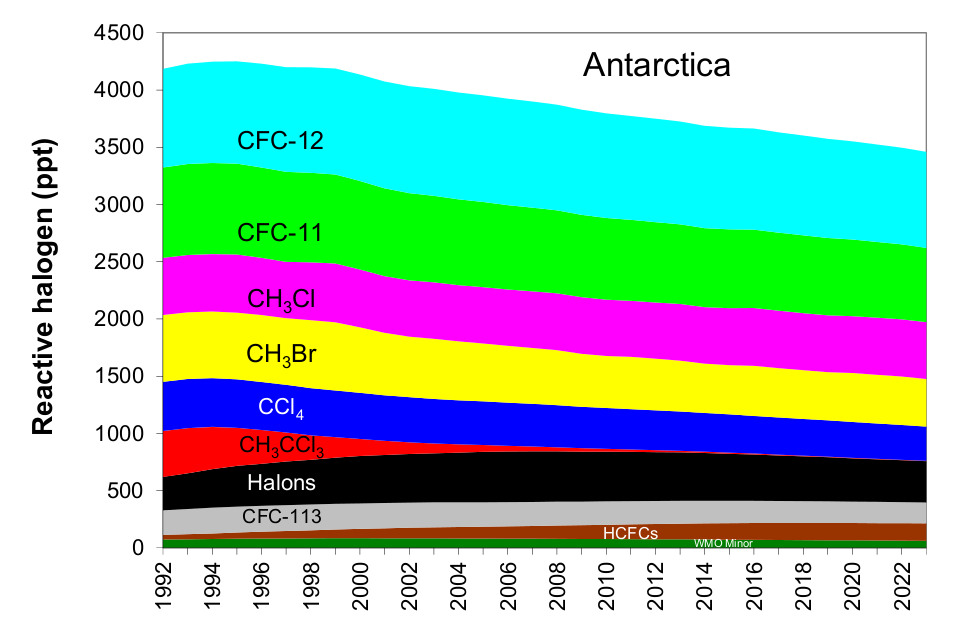
In order to identify the gases primarily responsible for the decline in the abundance of reactive halogen to date, the contributions of individual gases to total reactive halogen with weightings relevant for the Antarctic stratosphere is presented (Table 1 and Figure 4). Table 2 and Figure 5 give similar data with weightings relevant for the mid-latitude stratosphere. Of the ozone depleting gases for which production and international trade is restricted by the Montreal Protocol, NOAA measurements show that atmospheric concentrations of nearly all of the most abundant ODSs were decreasing in the atmosphere in 2024. Exceptions include the most abundant halon, H-1301, for which the global abundance has increased slightly in recent years, and a number of CFCs present in the atmosphere at less than 5 ppt (Western et al., 2023).
It is clear from Figures 4 and 5 that the initial decline in reactive halogen concentration was due primarily to the relatively rapid phase-out and atmospheric decline of shorter-lived chemicals such as methyl chloroform (CH3CCl3) and methyl bromide (CH3Br Montzka et al., 1999; 2003). With the successful phase out of their production for controlled dispersive uses, annual concentration decreases for these gases are now very small. As a result, a sustained decline in EESC in recent and future years relies on sustained decreases in emissions and concentrations of CFCs in particular. While the substantial drop in CFC-11 emission after 2019 has accelerated its decline (Montzka et al., 2021; Park et al., 2021), emissions and abundances of a number of long-lived CFCs present in the atmosphere at low concentrations continue to increase, many for unknown reasons (Western et al., 2023).
Methyl bromide and methyl chloride (CH3Br, CH3Cl) are unique among ozone-depleting gases because they have substantial natural sources. Despite the large natural source of CH3Br, its atmospheric concentration has declined after 1998, when reported total human industrial production was reduced owing to the Montreal Protocol restrictions. Production for controlled dispersive uses was essentially phased out by 2014, and since that time, the global CH3Br concentration has not changed appreciably, although year-to-year variations are observed observed that are likely related to enhanced burning during El Nino years (Nicewonger et al., 2021). Production for exempt uses continues, but amounts reportedly used for this purpose indicate no secular change during the past decade.
Although the concentrations of the three most abundant HCFCs have increased overall in the background atmosphere over the past two decades (see https://gml.noaa.gov/hats/about/hcfc.html), those trends have recently reversed for the two most abundant HCFCs and, for example, the sum of equivalent effective chlorine arising from the most abundant HCFCs has decreased since 2021 (Western et al., 2024). This overall decline has been observed despite slight increases in the atmospheric abundance of HCFC-141b (Western et al., 2022). The global phase-out of production and consumption of HCFCs for dispersive uses is scheduled for 2030 by the Montreal Protocol. At their current concentrations, the three most abundant HCFCs contribute 10% to the atmospheric burden of total chlorine and <5% to reactive halogen (as EESC).
The Montreal Protocol on Substances that Deplete the Ozone Layer is considered a success and could be a model for future efforts to stem climate change (Montzka et al., 2011). Notwithstanding this success, substantial depletion of the ozone layer continues to be observed in the Austral spring over Antarctica (Johnson et al., 2021). Full recovery is expected only with sustained declines in atmospheric chlorine and bromine in future years and continued adherence to the production and consumption restrictions outlined in the Protocol.
The timing of ozone layer recovery may be impacted by production and emission of controlled ODSs resulting from their use as feedstocks to create other chemicals or in chemical processes where the controlled substances are created as intermediates in chemical reaction schemes (Daniel and Reimann et al., 2022). Such production is not controlled by the Montreal Protocol, as it was originally thought emissions associated with this allowed production would be minimal (<0.5% of production). Recent studies have shown that emission for some gases are substantially higher than expected (e.g., CCl4; SPARC, 2016), and increases in global total emission and concentration of some controlled CFCs at lower abundance have been observed (Adcock et al., 2018; Vollmer et al., 2018; Daniel and Reimann et al., 2022; Laube and Tegtmeier et al., 2022; Western et al., 2023).
The ODGI also does not consider contributions to reactive halogen in the stratosphere from short-lived halogenated chemicals not controlled by the Montreal Protocol. Global concentrations of some of these chemicals, particularly dichloromethane, have increased substantially in recent years. At the present time their contribution to atmospheric chlorine is about one-third as large as total chlorine from atmospheric HCFCs (see NOAA data at https://gml.noaa.gov/aftp/hats/solvents/CH2Cl2/flasks/; and Hossaini et al., 2019).
Recovery of the ozone layer is expected as the ODGI value approaches zero, although the timing of the ozone layer's complete recovery will be influenced by other chemical and physical changes in atmospheric composition arising from anthropogenic emissions of long-lived greenhouse gases and their influence on atmospheric dynamics, stratospheric ozone, and the efficiency for chlorine and bromine to destroy stratospheric ozone (Hassler and Young et al., 2022).
The ODGI-A and ODGI-ML are important components of NOAA’s effort to guide the recovery of the ozone hole over Antarctica and the ozone layer in mid-latitudes. These indices provide a means by which adherence to international protocols can be assessed and they allow the public and policy makers to discern if policy measures are having their desired effect. Because ozone depletion is still near its peak, continued monitoring of ozone and ozone depleting gases is critical for ensuring that the recovery proceeds as expected through the 21st century.
| Year | CFC-12 | CFC-11 | CH3Cl | CH3Br | CCl4 | CH3CCl3 | halons | CFC-113 | HCFCs | WMO Minor | SUM* (ppt) | EESC SUM (ppt) | ODGI(old) Antarctic | ODGI(new) Antarctic |
|---|---|---|---|---|---|---|---|---|---|---|---|---|---|---|
| 1992 | 861 | 789 | 500 | 583 | 431 | 400 | 346 | 215 | 41 | 18 | 4184 | 3544 | 97.7 | 69.6 |
| 1993 | 876 | 795 | 500 | 583 | 429 | 393 | 368 | 219 | 44 | 18 | 4226 | 3666 | 99.0 | 75.7 |
| 1994 | 885 | 796 | 501 | 583 | 425 | 370 | 394 | 224 | 48 | 18 | 4244 | 3784 | 100.0 | 81.6 |
| 1995 | 895 | 793 | 508 | 583 | 422 | 333 | 416 | 226 | 53 | 19 | 4248 | 3888 | 99.4 | 86.8 |
| 1996 | 907 | 789 | 500 | 585 | 418 | 296 | 427 | 227 | 59 | 19 | 4227 | 3974 | 99.2 | 91.1 |
| 1997 | 915 | 786 | 492 | 582 | 414 | 254 | 443 | 226 | 65 | 19 | 4196 | 4041 | 98.3 | 94.5 |
| 1998 | 920 | 782 | 505 | 594 | 411 | 214 | 453 | 225 | 70 | 20 | 4194 | 4088 | 98.8 | 96.8 |
| 1999 | 926 | 778 | 513 | 596 | 407 | 179 | 467 | 223 | 76 | 21 | 4185 | 4119 | 97.5 | 98.4 |
| 2000 | 930 | 773 | 506 | 572 | 402 | 149 | 477 | 222 | 81 | 21 | 4133 | 4140 | 95.4 | 99.4 |
| 2001 | 932 | 768 | 496 | 545 | 397 | 124 | 483 | 221 | 87 | 20 | 4072 | 4151 | 93.0 | 100.0 |
| 2002 | 934 | 763 | 491 | 529 | 393 | 103 | 488 | 219 | 92 | 20 | 4031 | 4151 | 91.9 | 100.0 |
| 2003 | 934 | 756 | 494 | 525 | 388 | 86 | 491 | 217 | 96 | 20 | 4007 | 4137 | 91.0 | 99.3 |
| 2004 | 933 | 750 | 491 | 515 | 384 | 72 | 498 | 215 | 100 | 19 | 3977 | 4117 | 89.9 | 98.3 |
| 2005 | 932 | 743 | 492 | 505 | 380 | 60 | 504 | 213 | 103 | 18 | 3952 | 4094 | 89.0 | 97.1 |
| 2006 | 931 | 737 | 492 | 496 | 376 | 50 | 505 | 212 | 107 | 18 | 3923 | 4069 | 87.9 | 95.9 |
| 2007 | 927 | 731 | 495 | 488 | 371 | 42 | 504 | 210 | 111 | 18 | 3897 | 4043 | 87.3 | 94.6 |
| 2008 | 923 | 724 | 497 | 481 | 366 | 35 | 502 | 208 | 116 | 18 | 3869 | 4017 | 85.8 | 93.3 |
| 2009 | 919 | 719 | 496 | 463 | 359 | 29 | 498 | 206 | 121 | 17 | 3827 | 3990 | 84.3 | 91.9 |
| 2010 | 913 | 713 | 493 | 454 | 356 | 25 | 495 | 204 | 125 | 17 | 3795 | 3963 | 83.5 | 90.6 |
| 2011 | 908 | 707 | 490 | 456 | 351 | 21 | 490 | 202 | 129 | 17 | 3772 | 3933 | 0.0 | 89.1 |
| 2012 | 904 | 702 | 491 | 453 | 346 | 17 | 486 | 200 | 134 | 17 | 3749 | 3902 | 0.0 | 87.5 |
| 2013 | 899 | 696 | 495 | 444 | 341 | 14 | 481 | 199 | 138 | 17 | 3723 | 3872 | 0.0 | 86.0 |
| 2014 | 893 | 691 | 493 | 430 | 337 | 12 | 474 | 197 | 141 | 17 | 3685 | 3843 | 0.0 | 84.6 |
| 2015 | 888 | 688 | 499 | 429 | 332 | 10 | 467 | 195 | 145 | 16 | 3670 | 3815 | 0.0 | 83.2 |
| 2016 | 883 | 684 | 506 | 437 | 327 | 8 | 460 | 194 | 147 | 15 | 3661 | 3786 | 0.0 | 81.7 |
| 2017 | 877 | 681 | 502 | 431 | 323 | 7 | 452 | 192 | 149 | 15 | 3630 | 3759 | 0.0 | 80.4 |
| 2018 | 872 | 679 | 498 | 426 | 319 | 6 | 445 | 191 | 150 | 15 | 3602 | 3735 | 0.0 | 79.2 |
| 2019 | 866 | 676 | 497 | 422 | 315 | 5 | 439 | 189 | 151 | 15 | 3574 | 3711 | 0.0 | 78.0 |
| 2020 | 858 | 669 | 497 | 427 | 311 | 4 | 431 | 187 | 152 | 14 | 3551 | 3686 | 0.0 | 76.7 |
| 2021 | 852 | 662 | 499 | 426 | 306 | 4 | 424 | 185 | 152 | 14 | 3524 | 3660 | 0.0 | 75.4 |
| 2022 | 845 | 655 | 499 | 424 | 301 | 3 | 418 | 184 | 153 | 14 | 3495 | 3635 | 0.0 | 74.2 |
| 2023 | 839 | 648 | 495 | 415 | 297 | 3 | 414 | 182 | 152 | 14 | 3460 | 3609 | 0.0 | 72.9 |
| 2024 | 832 | 641 | 498 | 418 | 294 | 3 | 407 | 181 | 151 | 14 | 3438 | 3583 | 0.0 | 71.6 |
| Year | CFC-12 | CFC-11 | CH3Cl | CH3Br | CCl4 | CH3CCl3 | halons | CFC-113 | HCFCs | WMO Minor | SUM* (ppt) | EESC SUM (ppt; new) | ODGI(old) Mid Latitude | ODGI(new) Mid-Lat |
|---|---|---|---|---|---|---|---|---|---|---|---|---|---|---|
| 1992 | 230 | 375 | 242 | 326 | 242 | 271 | 172 | 69 | 13 | 6 | 1945 | 1795 | 98.8 | 82.0 |
| 1993 | 234 | 377 | 242 | 326 | 240 | 266 | 184 | 71 | 14 | 6 | 1961 | 1846 | 99.7 | 88.6 |
| 1994 | 237 | 378 | 242 | 326 | 238 | 250 | 196 | 72 | 16 | 6 | 1961 | 1888 | 100.0 | 94.0 |
| 1995 | 239 | 377 | 246 | 326 | 236 | 225 | 207 | 73 | 18 | 6 | 1953 | 1917 | 98.4 | 97.6 |
| 1996 | 242 | 375 | 242 | 327 | 234 | 200 | 213 | 73 | 20 | 7 | 1933 | 1932 | 97.4 | 99.6 |
| 1997 | 245 | 373 | 238 | 326 | 232 | 172 | 221 | 73 | 22 | 7 | 1908 | 1935 | 95.5 | 100.0 |
| 1998 | 246 | 371 | 244 | 333 | 230 | 145 | 227 | 72 | 24 | 7 | 1899 | 1928 | 95.3 | 99.1 |
| 1999 | 248 | 369 | 248 | 333 | 228 | 121 | 233 | 72 | 26 | 7 | 1886 | 1918 | 92.7 | 97.8 |
| 2000 | 249 | 367 | 245 | 320 | 225 | 101 | 239 | 71 | 28 | 8 | 1852 | 1907 | 89.3 | 96.4 |
| 2001 | 249 | 364 | 240 | 305 | 222 | 84 | 242 | 71 | 30 | 8 | 1815 | 1890 | 85.5 | 94.2 |
| 2002 | 250 | 362 | 238 | 296 | 220 | 70 | 245 | 71 | 32 | 7 | 1789 | 1866 | 83.5 | 91.1 |
| 2003 | 250 | 359 | 239 | 294 | 217 | 58 | 246 | 70 | 33 | 7 | 1774 | 1840 | 81.9 | 87.7 |
| 2004 | 250 | 356 | 238 | 288 | 215 | 48 | 249 | 69 | 35 | 7 | 1755 | 1816 | 79.9 | 84.7 |
| 2005 | 249 | 353 | 238 | 283 | 213 | 40 | 251 | 69 | 36 | 7 | 1739 | 1795 | 78.2 | 82.0 |
| 2006 | 249 | 350 | 238 | 277 | 210 | 34 | 251 | 68 | 37 | 7 | 1722 | 1776 | 76.3 | 79.4 |
| 2007 | 248 | 347 | 239 | 273 | 208 | 28 | 251 | 68 | 39 | 6 | 1707 | 1757 | 75.0 | 77.0 |
| 2008 | 247 | 344 | 240 | 269 | 205 | 24 | 249 | 67 | 40 | 6 | 1691 | 1740 | 72.6 | 74.8 |
| 2009 | 246 | 341 | 240 | 259 | 201 | 20 | 246 | 66 | 42 | 6 | 1668 | 1723 | 70.1 | 72.6 |
| 2010 | 244 | 339 | 238 | 254 | 199 | 17 | 244 | 66 | 43 | 6 | 1650 | 1705 | 68.8 | 70.3 |
| 2011 | 243 | 336 | 237 | 255 | 196 | 14 | 241 | 65 | 45 | 6 | 1638 | 1686 | 0.0 | 67.9 |
| 2012 | 242 | 333 | 237 | 253 | 194 | 12 | 239 | 65 | 46 | 6 | 1626 | 1669 | 0.0 | 65.7 |
| 2013 | 240 | 330 | 239 | 249 | 191 | 10 | 235 | 64 | 48 | 6 | 1612 | 1654 | 0.0 | 63.7 |
| 2014 | 239 | 328 | 239 | 241 | 189 | 8 | 231 | 63 | 49 | 6 | 1592 | 1640 | 0.0 | 61.9 |
| 2015 | 238 | 327 | 241 | 240 | 186 | 7 | 227 | 63 | 50 | 6 | 1584 | 1624 | 0.0 | 59.8 |
| 2016 | 236 | 325 | 244 | 245 | 183 | 6 | 222 | 62 | 51 | 5 | 1580 | 1610 | 0.0 | 58.0 |
| 2017 | 235 | 323 | 243 | 241 | 181 | 5 | 218 | 62 | 51 | 5 | 1564 | 1599 | 0.0 | 56.6 |
| 2018 | 233 | 323 | 241 | 239 | 179 | 4 | 214 | 61 | 52 | 5 | 1550 | 1587 | 0.0 | 55.1 |
| 2019 | 232 | 321 | 240 | 236 | 176 | 4 | 210 | 61 | 52 | 5 | 1537 | 1575 | 0.0 | 53.5 |
| 2020 | 230 | 318 | 240 | 239 | 174 | 3 | 206 | 60 | 52 | 5 | 1527 | 1562 | 0.0 | 51.8 |
| 2021 | 228 | 314 | 241 | 238 | 171 | 3 | 202 | 60 | 53 | 5 | 1515 | 1550 | 0.0 | 50.3 |
| 2022 | 226 | 311 | 241 | 237 | 169 | 2 | 199 | 59 | 53 | 4 | 1501 | 1538 | 0.0 | 48.7 |
| 2023 | 224 | 308 | 239 | 232 | 166 | 2 | 196 | 59 | 52 | 4 | 1483 | 1525 | 0.0 | 47.1 |
| 2024 | 222 | 304 | 241 | 234 | 164 | 2 | 192 | 58 | 52 | 4 | 1474 | 1511 | 0.0 | 45.3 |
Notes for tables 1 and 2: “Halons” represents the aggregate of H-1211, H-1301 and H-2402; “HCFCs” represents the aggregate of HCFC-22, HCFC-141b, and HCFC-142b; “WMO minor” represents CFC-114, CFC-115, halon 2402 and halon 1201 (Daniel and Reimann et al., 2022). “SUM* (ppt)” represents the amount of reactive halogen weighted by fractional release factors but without transport lag times considered, whereas reactive halogen expressed as “EESC” includes consideration of lag times for transport and mixing associated with transport. Values are derived directly from measured lower tropospheric global mean abundances without any adjustments.
Improvements in the calculation of the ODGI initiated in 2012:
- The ODGI now includes updated estimates of halocarbon decomposition rates in the stratosphere for most ODSs. These revised “fractional release” factors are derived from the stratospheric observations of Schauffler et al. (2003) and have been used subsequently in deriving stratospheric trends of ozone-depleting halogen in Newman et al. (2007) and in the WMO Scientific Assessment of Ozone Depletion Reports (Montzka and Reimann et al., 2011; Daniel and Velders et al., 2011).
- The ODGI now expresses compositional changes relevant for the present day in the mid-latitude and Antarctic stratosphere. Previously the ODGI reflected tropospheric changes without explicit consideration of transport times. Previously the ODGI also reflected changes through mid-year of the year indicated. It now is an estimate of changes at the beginning of the year indicated.
- The ODGI is derived from EESC, which includes consideration of stratospheric mixing processes that act to dampen tropospheric changes (as in Waugh and Hall et al., 1992 and Newman et al., 2007).
Note:
NOAA observations that are used to derive the ODGI can be found within the directories at: https://gml.noaa.gov/aftp/hats
or with the interactive data viewer at: https://gml.noaa.gov/dv/iadv/
and global means are summarized in the file '2024 update total Cl Br & F.xls' at the location gml.noaa.gov/aftp/hats/Total_Cl_Br/
Acknowledgements
We gratefully acknowledge all those involved in sampling and analysis of air samples both within NOAA and within the cooperative air sampling network. We particularly thank Brad Hall for his attention to detail in preparation and maintenance of accurate standard scales for these trace gases, and Scott Clingan, Molly Crotwell, David Nance, Kyle Peterson, Carolina Siso (retired), Debbie Mondeel (retired), and Ben Miller (retired) for data. This research was supported in part by the NOAA Climate Program Office.
References
- Adcock, K. et al., CFC-113a (CF3CCl3) in the atmosphere: an update of distributions, trends, emissions and potential source, Atmos. Chem. Phys., 18, 4737–4751, doi:10.5194/acp-18-4737-2018, 2018.
- Daniel, J.S., and S. Reimann (Coordinating Lead Authors), P. Ashford, E.L. Fleming, R. Hossaini, M.J. Likely, R. Schofield, H. Walter-Terrinoni, Scenarios and information for policymakers, Chapter 7 in Scientific Assessment of Ozone Depletion: 2022, Global Atmosphere Watch Report No. 278, World Meteorological Organization, Geneva, 2022.
- Engel A., H. Bönisch, J. Ostermöller, M.P Chipperfield, S. Dhomse, and P. Jöckel, A refined methods for calculating equivalent effective stratospheric chlorine, Atmos. Chem. Phys., 2018, 601-609, doi:10.5194/acp-18-601-2018, 2018.
- Hassler, B., and P. Young (Coordinating Lead Authors), W.T. Ball, R. Damadeo, J. Keeble, E.Maillard Barras, V. Sofieva, G. Zeng, Chapter 3 in Scientific Assessment of Ozone Depletion: 2022, Global Ozone Research and Monitoring Project – Report No. 278, World Meteorological Organization, Geneva, Switzerland, 2022.
- Hossaini, R. E. Atlas, S.S. Dhomse, M.P. Chipperfield, P.F. Bernath, A.M. Fernando, J. Mühle, A.A. Leeson, S.A. Montzka, W. Feng, J.J. Harrison, P. Krummel, M.K. Vollmer, S. Reimann, S. O’Doherty, D. Young, M. Maione, J. Arduini, C.R. Lunder, Recent trends in stratospheric chlorine from very short-lived substances, J. Geophys. Res., 124, 4, 2318-2335, doi:10.1029/2018JD029400, 2019.
- Laube and Tegtmeier et al., Update on Ozone-Depleting Substances (ODSs) and Other Gases of Interest to the Montreal Protocol, Chapter 1 in Scientific Assessment of Ozone Depletion: 2022, Global Atmosphere Watch Report No. 278, World Meteorological Organization, Geneva, 2022.
- Montzka, S.A., E.J. Dlugokencky, J.H. Butler, Non-CO2 greenhouse gases and climate change, Nature, 476, 43-50, doi:10.1038/nature10322, 2011.
- Montzka, S.A, J.H. Butler, B.D. Hall, J.W. Elkins, D.J. Mondeel, A decline in tropospheric organic bromine, Geophy. Res. Lett., 30(15), 1826, doi:10.1029/2003GL017745, 2003.
- Montzka, S.A., J.H. Butler, J.W. Elkins, T.M. Thompson, A.D. Clarke, and L.T. Lock, Present and future trends in the atmospheric burden of ozone-depleting halogens, Nature, 398, 690-694, 1999.
- Montzka, S.A., and S. Reimann (Coordinating Lead Authors), A. Engel, K. Krüger, S. O'Doherty, W.T Sturges, D. Blake, M. Dorf, P. Fraser, L. Froidevaux, K. Jucks, K. Kreher, M.J. Kurylo, A. Mellouki, J. Miller, O.-J. Nielsen, V.L. Orkin, R.G. Prinn, R. Rhew, M.L. Santee, A. Stohl, and D. Verdonik, Ozone-depleting substances (ODSs) and related chemicals, Chapter 1 in Scientific Assessment of Ozone Depletion: 2010, Global Ozone Research and Monitoring Project–Report No. 52, 516 pp., World Meteorological Organization, Geneva, Switzerland, 2011.
- Newman, P.A., J.S. Daniel, D.W. Waugh, E.R. Nash, A new formulation of equivalent effective stratospheric chlorine (EESC), Atmos, Chem. Phys., 7, 4537-4552, 2007.
- Nicewonger, M.R., E.S. Saltzman, S.A. Montzka, ENSO-driven fires cause large interannual variability in the naturally emitted, ozone-depleting trace gas methyl bromide, Geophys. Res. Lett., 49, e2021GL094756. https://doi.org/10.1029/2021GL094756, 2022.
- Schauffler, S. M., Atlas, E. L., Donnelly, S. G., Andrews, A., Montzka, S. A., Elkins, J. W., Hurst, D. F., Romashkin, P. A., Dutton, G. S., and Stroud, V.: Chlorine budget and partitioning during the Stratospheric Aerosol and Gas Experiment (SAGE) III Ozone Loss and Validation Experiment (SOLVE), J. Geophys. Res., 108(D5), 4173, doi:10.1029/2001JD002040, 2003.
- SPARC, SPARC Report on the Mystery of Carbon Tetrachloride, Liang, Q., Newman, P.A., and Reimann, S., eds., Report No. 7, WCRP-13/2016, 2016.
- Vollmer, M.K., et al., Atmospheric histories and emissions of chlorofluorocarbons CFC-13 (CClF3), ΣCFC-114 (Ci2Cl2F4), and CFC-115 (C2ClF5), Atmos. Chem. Phys., 18(2), 979-1002, doi:10.5194/acp-18-979-2018, 2018.
- Waugh, D.W., and T.M. Hall, Age of stratospheric air: Theory, observations, and models, Rev. Geophys., 40, 4, doi:10.1029/2000RG000101, 1992.
- Western, L. et al., A renewed rise in global HCFC-141b emissions between 2017-2021, Atmos. Chem. Phys., 22, 9601-9616, 2022. https://doi.org/10.5194/acp-22-9601-2022.
- Western, L.M., M.K. Vollmer, P.B. Krummel, K.E. Adcock, P.J. Fraser, C.M. Harth, R.L. Langenfelds, S.A. Montzka, J. Muhle, S. O’Doherty, D. E. Oram, S. Reimann, M. Rigby, I. Vimont, R. F. Weiss, D. Young, J. C. Laube, Global increase of ozone-depleting chlorofluorocarbons from 2010 to 2020, Nat. Geosci., 16, 309-313, https://doi.org/10.1038/s41561-023-01147-w, 2023.