
Highlights of GML’s contributions to the 2020 BAMS State of the Climate Report
On August 25, 2021, the Bulletin of American Meteorological Society State of the Climate 2020 report was released. The report provides a detailed update on global climate indicators, notable weather events, and other data collected by environmental monitoring stations and instruments located on land, water, ice, and in space.
Scientists from Global Monitoring Laboratory contributed to the report as editors and authors, providing updates on Mauna Loa’s apparent transmission, long-lived greenhouse gases, ozone-depleting substances, stratospheric water vapor, and the 2020 Antarctic ozone hole.
Mauna Loa Apparent Transmission
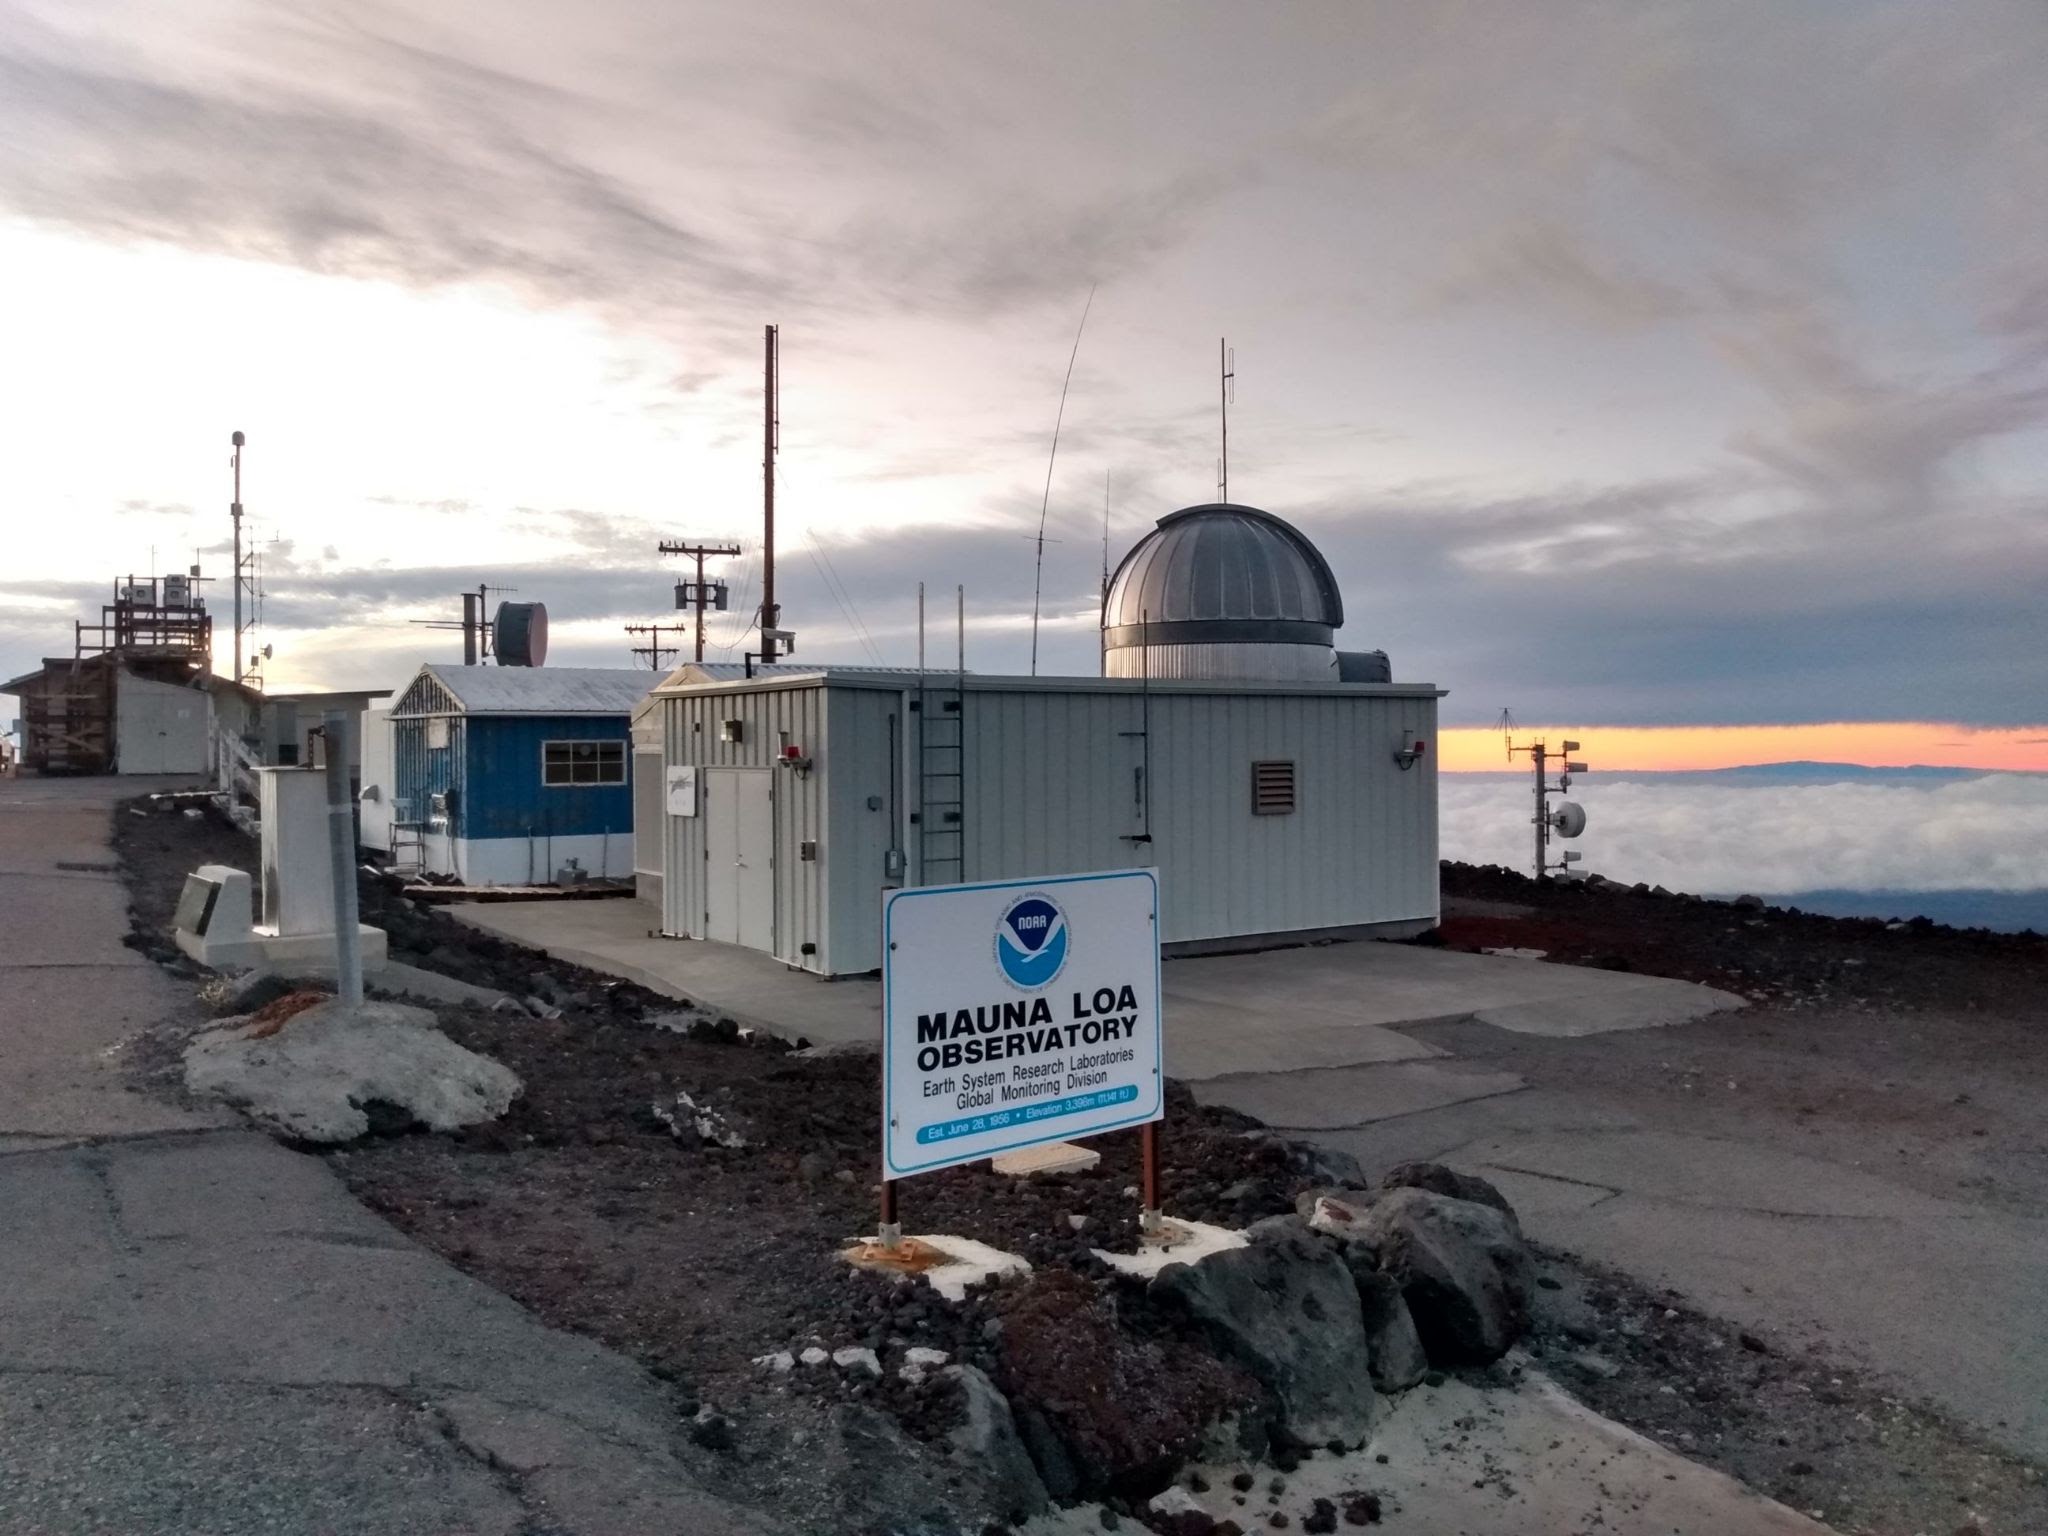
The Mauna Loa solar transmission has a long record history since 1958. When transmission decreases, more aerosols are present in the stratosphere to block solar radiation, which in turn have a cooling effect on climate.
The update in Mauna Loa’s apparent transmission suggests that by the end of October 2020, the tropical stratospheric reservoir was filled with declining aerosols from the Raikoke and Ulawun eruptions in summer 2019.
The only major volcanic event in 2020 was the explosive eruption of Mt. Taal in the Philippines on 12 January, but there is no indication from the Cloud-Aerosol Lidar with Orthogonal Polarization (CALIOP) space-borne lidar that it significantly affected the stratosphere.
Aerosol injection from California and massive Australian wildfires did not affect the transmission at Mauna Loa.
Long-lived Greenhouse Gases
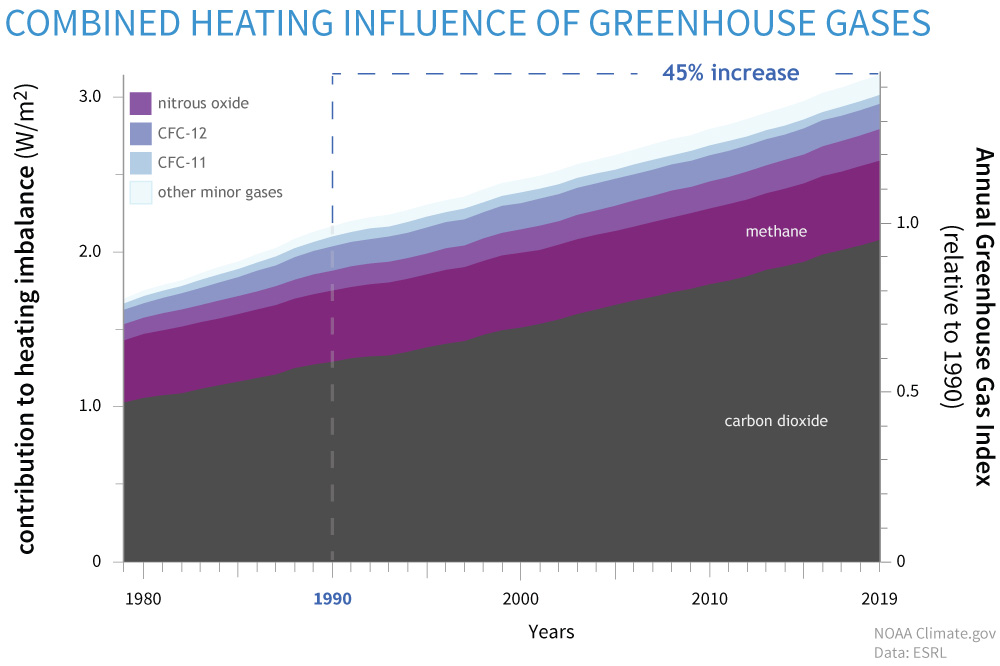
Despite a 6–7% drop in CO2 emissions resulting from economic disruptions due to the global COVID19 pandemic during most of 2020, this was not enough to noticeably slow the accumulation of atmospheric CO2.
All major greenhouse gases, including CO2, reached new record high concentrations for the year. The annual global average carbon dioxide concentration at Earth’s surface was 412.5 ± 0.1 ppm, 2.5 ± 0.1 ppm more than in 2019, and the highest in the past four million years. The year-over-year increase in the global CO2 levels has tripled over the past half-century, from an average of 0.8 ± 0.3 ppm per year in the 1960s to 2.4 ± 0.4 ppm per year in the 2010s.
Methane’s abundance in the atmosphere increased to 1879.2 ± 1.0 ppb in 2020, a 160% increase compared to its pre-industrial level of 722 ± 15 ppb. The CH4 annual increase in 2020 (14.8 ± 0.5 ppb) is the largest since our systematic measurements started in 1983.
The mean global atmospheric abundance of nitrous oxide in 2020, a long-lived greenhouse gas that depletes ozone, was 333.0 ± 0.1 ppb, while the annual increase in 2020 was 1.4 ± 0.1 ppb.
The combined radiative forcing in 2020 from major and minor long-lived greenhouse gases was 3.2 W m−2, with CO2 responsible for about 65% of radiative forcing by long-lived greenhouse gases, and its increase during 2015–20 accounting for 82% of the total increase in radiative forcing.
Ozone-depleting Substances
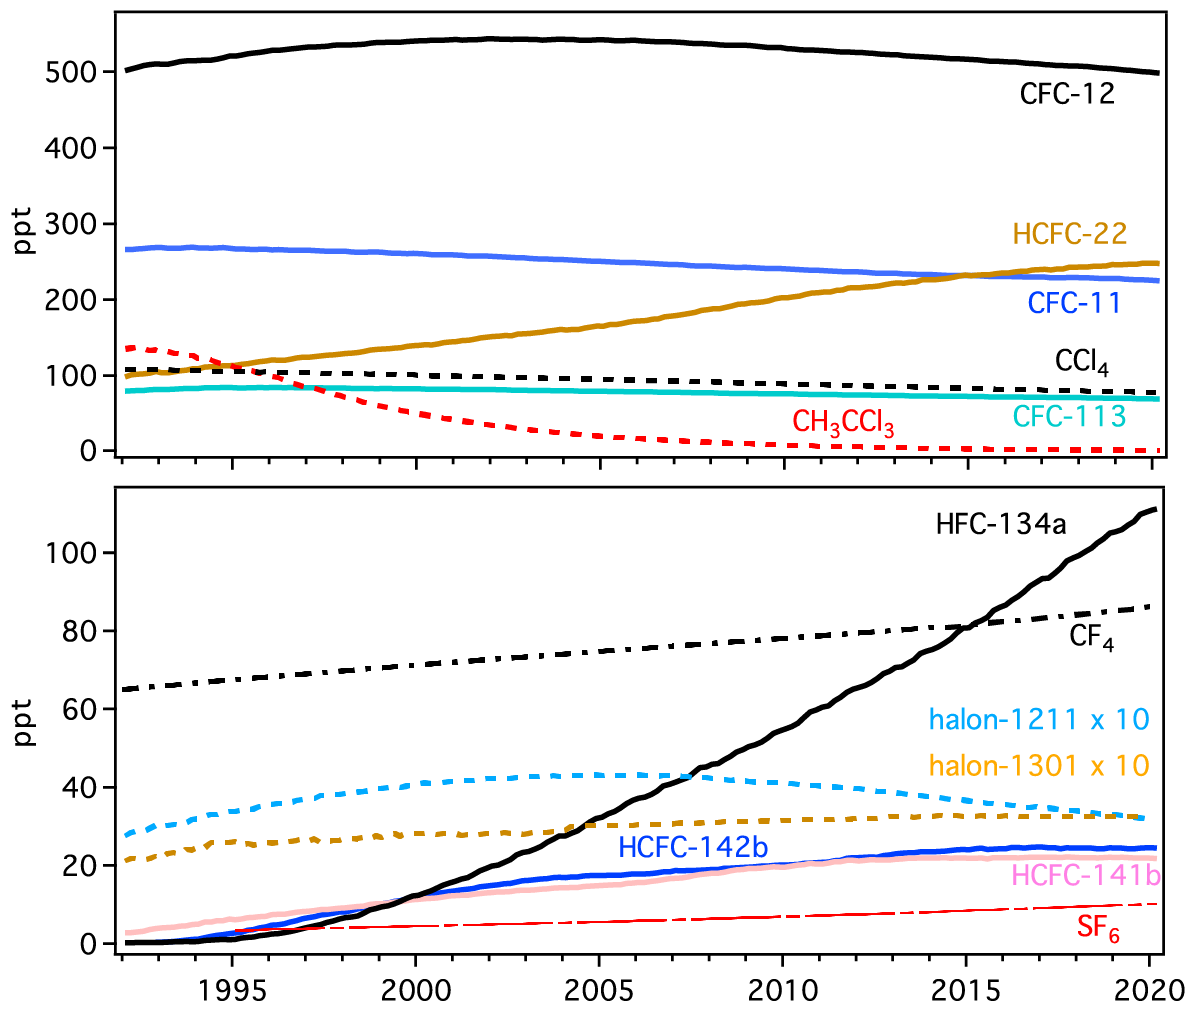
The Montreal Protocol (1987) and its subsequent amendments regulate the production and consumption of these ozone-depleting substances (ODS) and other compounds. These controls have resulted in declines in atmospheric abundance for many of these gases. CFC-11 and CFC-12 declined 16% ± 1% and 8% ± 0.3%, respectively, from their maximum values by 2020.
While the reduction of CFC-11 in the atmosphere slowed after 2012 owing to an unexpected increase in emissions that were likely linked to unreported production of CFC-11, continued monitoring has shown an accelerated decline from 2018 to 2019, signaling a decline in these emissions.
The year 2020 marks the near-complete phaseout of HCFCs in developed countries. Growth rates of atmospheric HCFC22, HCFC-141b, and HCFC-142b have slowed. Notably, the atmospheric abundances of both HCFC-141b and HCFC-142b have remained nearly constant since 2018.
Stratospheric Water Vapor
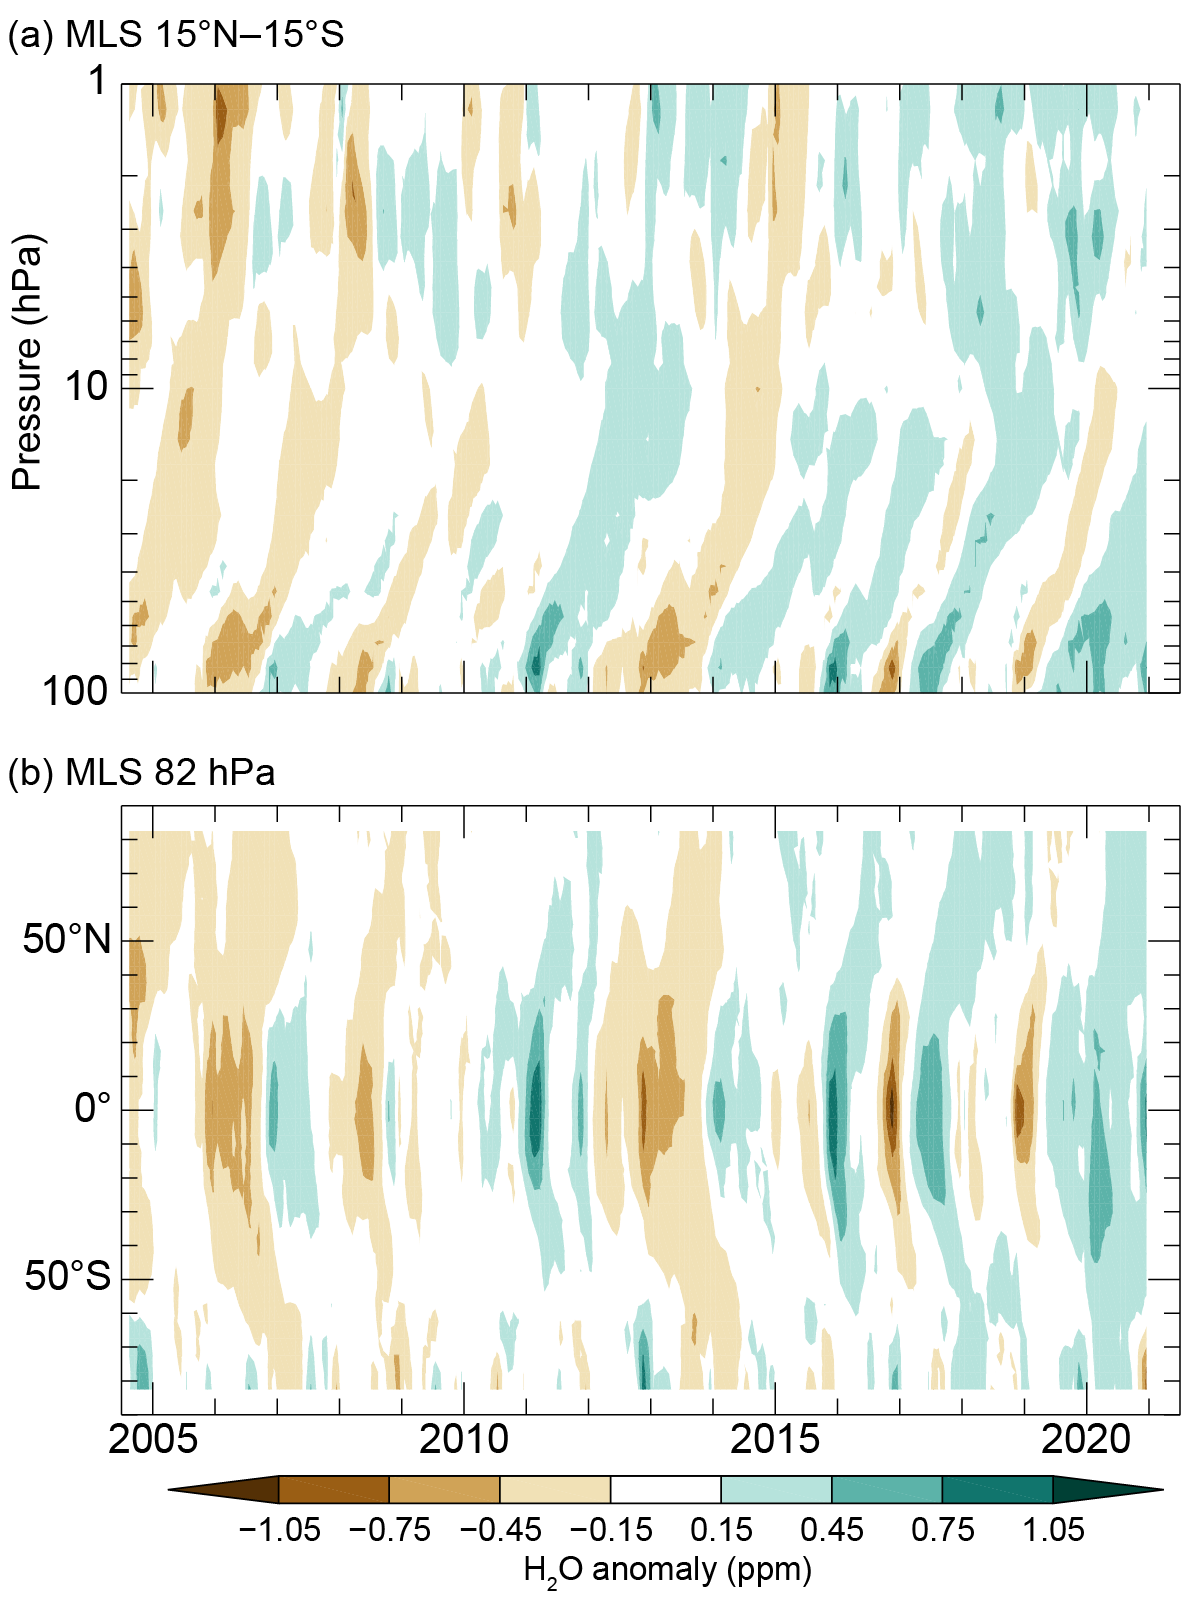
Stratospheric water vapor mixing ratios in the tropical lower stratosphere were slightly higher than normal at the start of 2020, but by the end of 2020 were 22% greater than normal. This change reflects a warming of the tropical tropopause layer during 2020, with temperature anomalies increasing from ~ 0°C in January to > 1°C in December.
Consequently, lower stratospheric water vapor anomalies were positive throughout 2020 at all latitudes except south of ~60°S in December, when very dehydrated air from the exceptionally long-lived Antarctic vortex spread northward.
2020 Antarctica Ozone Hole
The 2020 ozone hole was the 12th largest since the start of the NASA satellite observational record in 1979 at 23.5 Mkm2 (the average area for 7 September to 13 October), with a minimum total ozone column of 94 Dobson units (DU).
The 2020 austral spring was marked by a lack of planetary wave activity that resulted in a cold and stable polar stratospheric vortex. This strong vortex delayed the winter-to-summer circulation transition by several weeks, leading to the longest-lived ozone hole in the observational record over the Antarctic.
Record low ozone values in late austral spring and early summer led to unusually high levels of ultraviolet (UV) radiation in the Antarctic region.