
Surface ozone depletion events are taking place in Utqiaġvik, Alaska
By Xinyi Zeng (xinyi.zeng@noaa.gov), Science Communications Specialist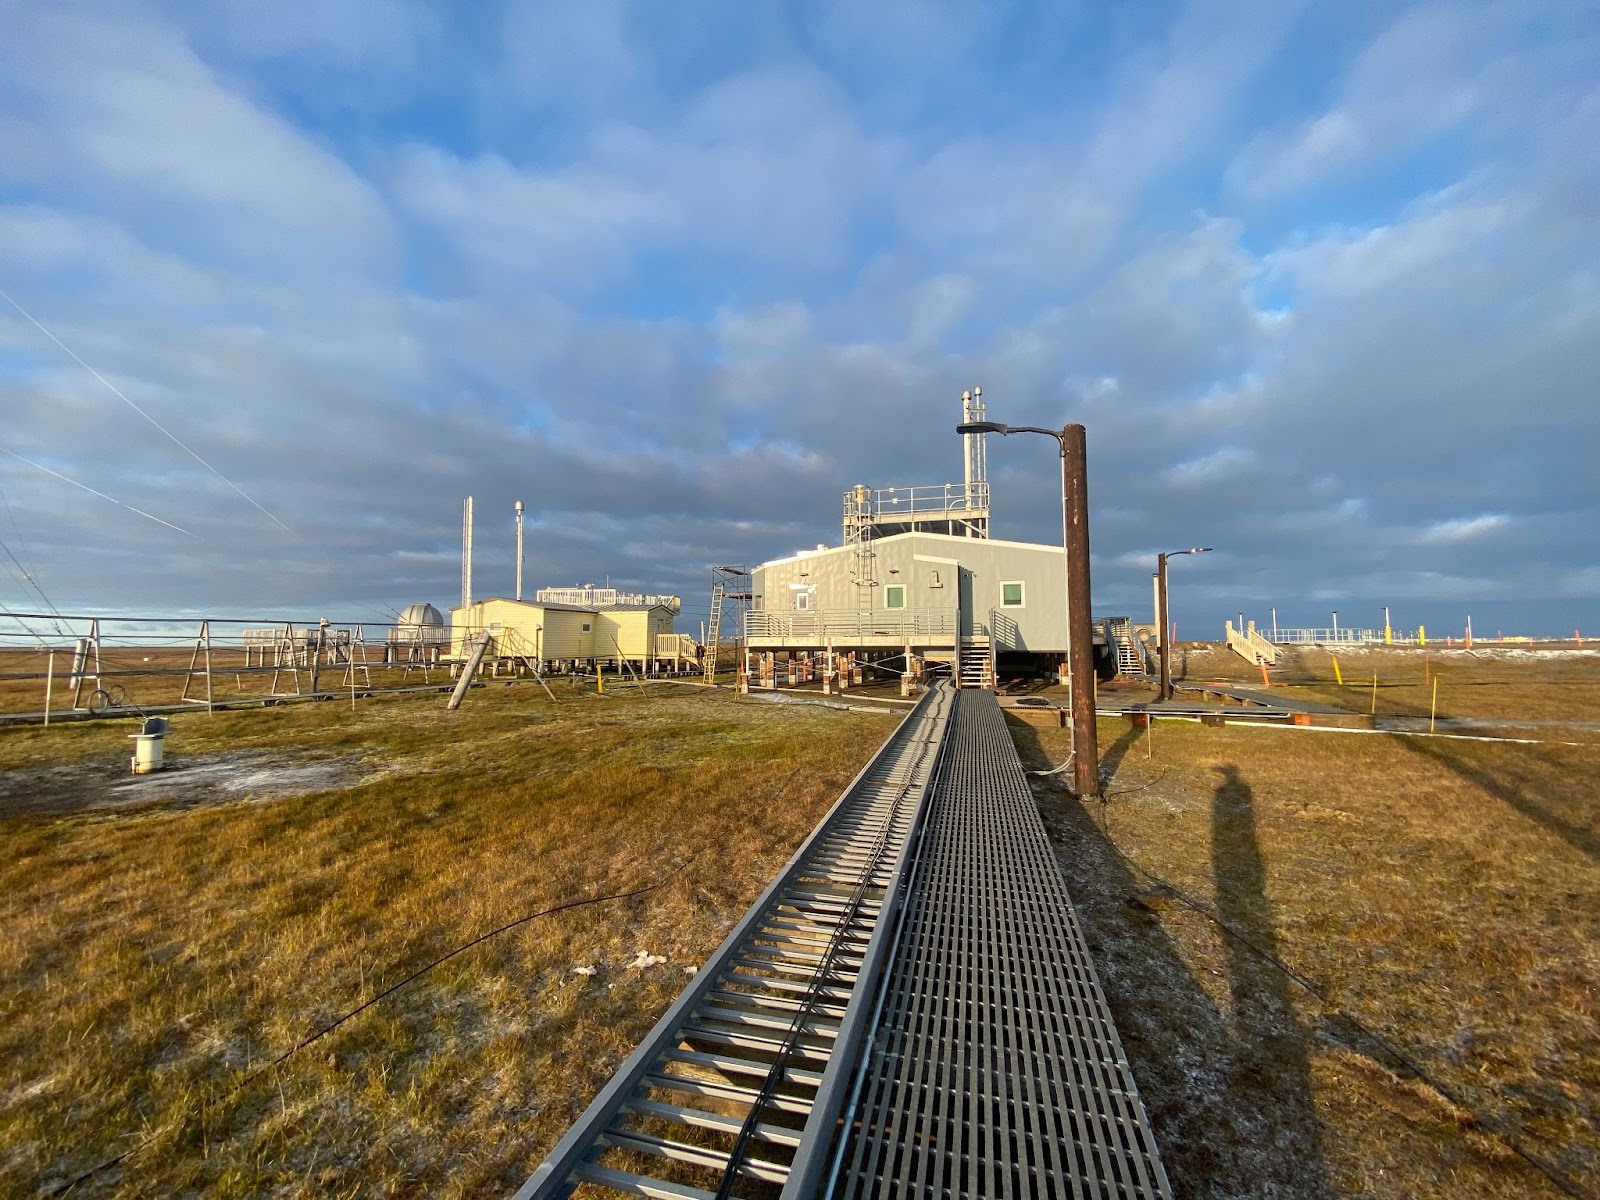
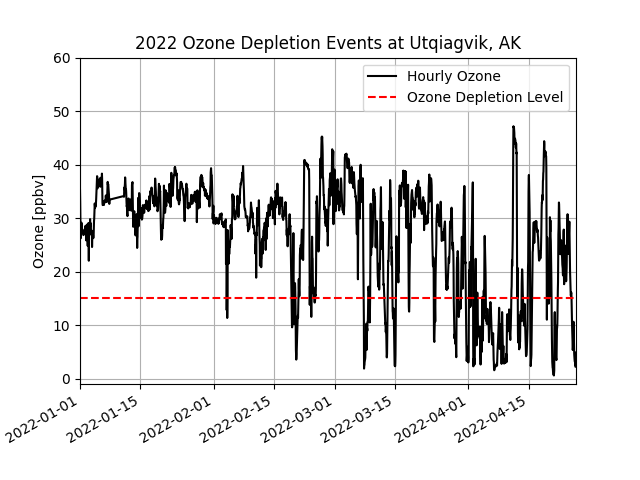
Springtime (March-May) in the arctic is the prime time for surface ozone depletion events. Since March, several depletion events have been captured by surface ozone measurements at NOAA Barrow Atmospheric Research Observatory near Utqiaġvik, Alaska.
“Typical surface ozone concentrations in the Arctic are around 30 to 40 parts per billion,” said Peter Effertz, CIRES researcher working at the Global Monitoring Laboratory, “but during these depletion events, the concentrations can drop to as low as 0-2 parts per billion.”
While stratospheric ozone protects the Earth's surface from damaging UV radiations, ozone acts as an atmospheric cleaning agent, a greenhouse gas, and a pollutant in the troposphere. It is the main precursor to the hydroxyl radicals and the hydroxyl radicals control the oxidation process to remove volatile organic compounds and other pollutants in the troposphere. The formation and removal of ozone are studied very closely for scientific research, regulatory, and human health purposes. As the arctic changes more rapidly than the rest of the planet, ozone is a key atmospheric constituent to monitor.
These depletion events are a result of the special chemistry in the Arctic environment. Bromine from sea salt builds up in the snowpack during the Arctic winter. In the spring, the sun releases the bromine from frozen surfaces which then reacts with ozone near the surface. Because aerosols and ice crystals can recycle bromine back into the gas phase, this mechanism keeps the bromine concentrations high near the ground to continuously deplete ozone for an extended period.
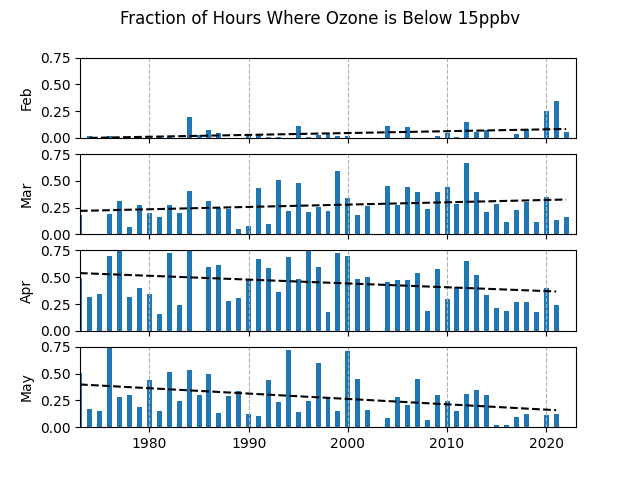
Since 1973, NOAA has been recording these events. The records show that the events may be starting earlier in the year than usual. Earlier Arctic sea ice melt might cause the observed change. However, a lot of uncertainties still remain in the mechanism, trends, and implications of surface ozone depletion in the Arctic.
NOAA’s long-term ozone observations in the Arctic will provide one piece of information to further understand this process. Researchers from Stonybrook University are planning to collect more atmospheric observations with airplanes to understand these ozone depletion events. NOAA’s data will be used as a part of this study.