
Unexpected Seasonal Cycle of US Anthropogenic Methane Emissions
L. Hu1, A.E. Andrews1, S.A. Montzka1, S. Ibarra-Espinosa2, S. Miller3, N. Miles4, K. Davis4,5, Z. Barkley4, L. Bruhwiler1, C. Sweeney1, A. Crotwell2, K. McKain1, Y. Oh2,1, X. Lan2,1, K. Thoning1 and M. Madronich2,1
1NOAA Global Monitoring Laboratory (GML), Boulder, CO 80305; 720-319-7805, E-mail: lei.hu@noaa.gov
2Cooperative Institute for Research in Environmental Sciences (CIRES), University of Colorado, Boulder, CO 80309
3Stanford University, Stanford, CA 94305
4The Pennsylvania State University, Department of Meteorology and Atmospheric Science, University Park, PA 16802
5The Pennsylvania State University, Earth and Environmental Systems Institute, University Park, PA 16802
Methane is a major greenhouse gas (GHG) that has contributed to one third of the warming induced by all GHGs since the preindustrial era (IPCC, 2021). Reliable quantification of methane emissions is critical in tracking progress towards methane mitigation, especially over the U.S. where the government has firm plans for reducing its national methane emissions. Atmosphere-based top-down estimates play a vital role in supplying an independent, measurement-based emission estimate that complements the Environmental Protection gency's (EPA) annual GHG inventories with additional temporal information. In this study, we quantified U.S. methane emissions using inverse modeling of ground- and airborne- methane measurements made from the NOAA Greenhouse Gas Reference Network for 2007 – 2021. Our results show an unforeseen seasonal cycle in anthropogenic methane emissions from the U.S. in all model scenarios, where we considered different transport models, different a priori emissions, and different background estimates for all years of our analysis. The derived seasonal emissions were most pronounced in the major natural gas production region and is similar to the seasonal variability of ethane and propane derived for the U.S. Both suggest this season emissions were likely caused by national gas-related activities.
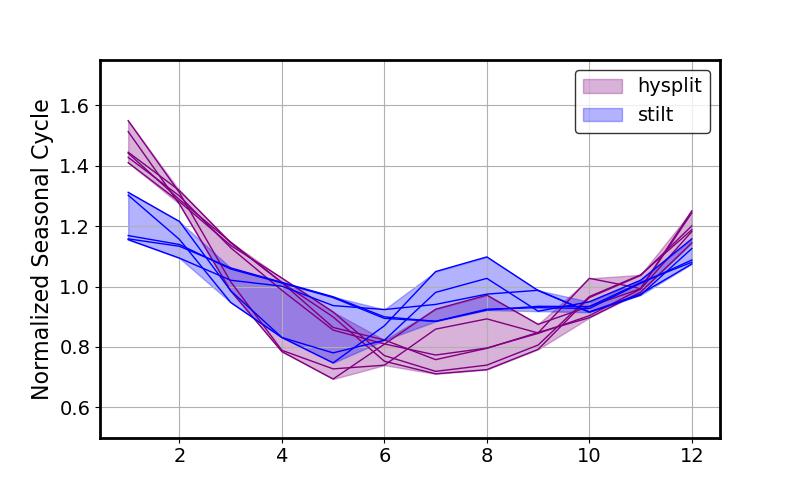
Figure 1. Seasonal cycle of methane derived from atmospheric inverse modeling using whole-air flask measurements from NOAA’s Greenhouse Gas Reference Network. Seasonal cycle was calculated by derived monthly emissions normalized by annual emissions and averaged between 2008 and 2017.