
Updates to the Operational UV Index – Validation Against GRAD Observations
C.S. Long1, H. Lee2 and L.M. Ciasto2
1Retired from the NOAA National Weather Service, National Centers for Environmental Prediction, Climate Prediction Center, College Park, MD 20740; 410-627-2139, E-mail: craig.s.long@gmail.com
2NOAA National Weather Service, National Centers for Environmental Prediction, Climate Prediction Center, College Park, MD 20740
The current version of the UV Index forecast system was implemented in 2005. The forecast system makes use of NCEP forecasts of total ozone, cloud transmission in the UV part of the spectrum, and the surface albedo in the presence of snow. At that time there was no forecast of tropospheric aerosols, so an aerosol climatology is used. Validation of the UV Index using GRAD observations showed that the forecasts overestimated the surface UV when wild fire smoke or African dust were present. In the last couple years NCEP has been working on producing operational aerosol forecasts resulting in greater location and accuracy than using any climatology. CPC has been testing the use of these aerosol forecasts in the UV Index forecasts with significant improvements even in areas not impacted by smoke or dust. Other improvements (0.25° grid output spacing, using hourly vs 3 hourly radiation forecasts) will also be put in place. The validation exercises also helped to identify problems in the ground observation networks (calibration, maintenance, etc) that were otherwise unnoticed. This presentation will highlight all the improvements to the UV Index forecast system with emphasis on the aerosol contribution.
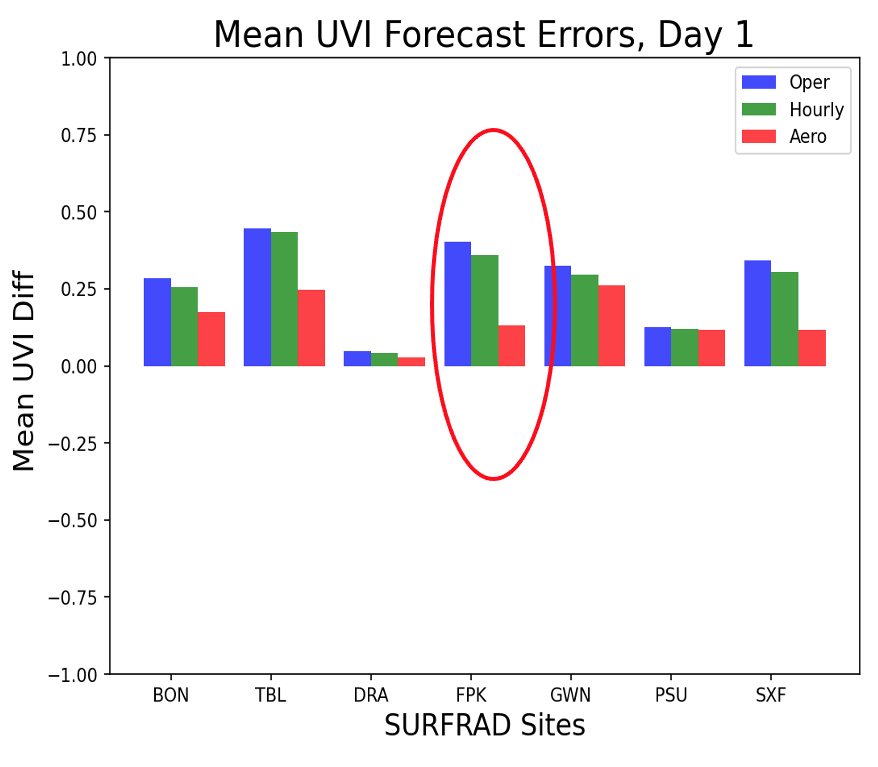
Figure 1.
UVI Day-1 Forecast Bias at the SURFRAD sites, assessed for the Operational (blue), Hourly (green), Hourly+GEFS_Aerosol (red) models, with all hourly data over the period Jul2021-Jun2022. Note that the forecasts with aerosols decreased the UVI forecast errors particularly at Fort Peck where smoke from wild fires impacted the observations.
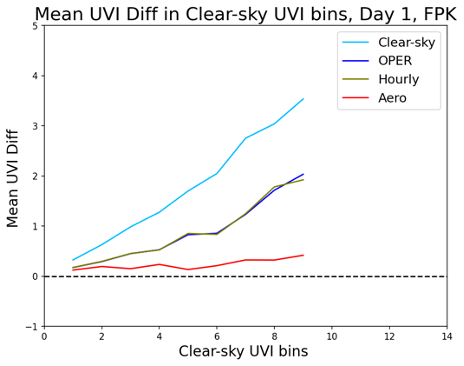
Figure 2.
The UVI Forecast bias errors are stratified by the clear-sky UVI to homogenize the assessment bases. The UVI Forecast Biases for v2.0.0 (”Aero”, red) at Fort Peck is clearly seen to be significantly reduced from the current model (“OPER”, blue) and are more uniformly distributed over clear-sky bins.