
Stratospheric Ozone Vertical Distribution at Select NOAA Global Monitoring Laboratory Dobson Monitoring Stations and Updated Trends of the Based on the LOTUS Regression Model
J.D. Wild1,2, I. Petropavlovskikh3,4, P. Effertz3,4, K. Miyagawa5, S. Strahan6, L. Flynn7, E. Beach7, G. McConville3,4, B.J. Johnson4, G. Ancellet8, R. Querel9 and R. Stübi10
1Earth System Science Interdisciplinary Center, University of Maryland, College Park, MD 20740; 443-878-4137, E-mail: jeannette.wild@noaa.gov
2NOAA Center for Satellite Applications and Research (STAR), College Park, MD 20740
3Cooperative Institute for Research in Environmental Sciences (CIRES), University of Colorado, Boulder, CO 80309
4NOAA Global Monitoring Laboratory (GML), Boulder, CO 80305
5Guest Scientist at NOAA Global Monitoring Division (GML), Boulder, CO 80305
6NASA Goddard Space Flight Center (GSFC), Universities Space Research Association (USRA), Greenbelt, MD 20771
7NOAA National Environmental Satellite, Data, and Information Service (NESDIS), Camp Springs, MD 20746
8LATMOS, Université Pierre et Marie Curie and Centre National de la Recherche Scientifique (CNRS), Paris, France
9National Institute of Water and Atmospheric Research (NIWA), Wellington, New Zealand
10Federal Office of Meteorology and Climatology, MeteoSwiss
NOAA’s ground-based (GB) remote sensing and in situ instruments continuously track stratospheric ozone recovery in response to the Montreal Protocol and its amendments. Long-term records of daily Dobson total column ozone, daily Dobson/Umkehr vertical ozone distribution (with a recent new homogenization), and weekly ozonesonde profiles are well-calibrated. Regular intra-instrument comparisons aid in the tracking of instrumental changes. Additionally, NOAA’s homogenized satellite record (COH) from SBUV, SBUV/2 and OMPS provides information on ozone vertical distribution in zonal averages allowing the study of large-scale ozone variability. Overpass datasets provide further GB validation including verification of the homogenization of the GB records. The NOAA AC4 funded project assesses the consistency of the trends derived from the different records. We present an updated evaluation of stratospheric ozone profile trends from the long-term ozone record with focus on the 2000–2020 period. Analyses were performed using the updated version (0.8.0) of the Long-term Ozone Trends and Uncertainties in the Stratosphere (LOTUS) Independent Linear Trend regression model. We primarily focus on Boulder, Colorado (40.0N, 105.3W), Haute Provence, France (43.9N, 5.8E), Lauder, New Zealand (45.04S, 169.68E), and Mauna Loa and Hilo, Hawaii (19.5N, 155.58W) which have both sonde and Umkehr measurements, and other stations of opportunity (i.e. Arosa, Switzerland (46.8N, 9.68E).
The Northern Hemispheric sites of Arosa, Haute Provence, and Mauna Loa all show positive trends in the mid to upper Stratosphere with trends peaking at ~3%/decade. Trends in the upper stratosphere at Boulder and Lauder are positive, but not statistically significant. In the lower stratosphere, trends are mostly negative, but trend uncertainties here are quite large. The causes of differences in ozonesonde trends at Lauder and OHP as compared to other datasets are being explored.
We also investigate additional dynamical proxies (Equivalent Latitude, Tropopause Pressure, additional QBO components for example) in the LOTUS model at these sites. We will discuss the addition of these proxies and the impact on the trends and uncertainties.
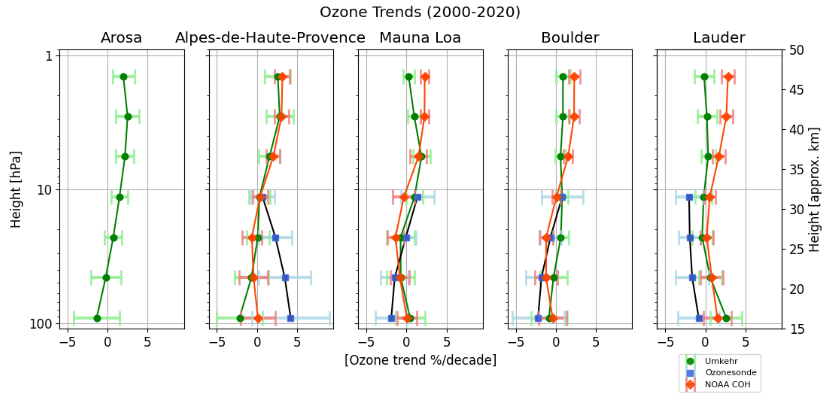
Figure 1. LOTUS trends at five stations with GB and overpass data.