
Identifying Methane Emissions from Animal Feeding Operations in a Mixed Emission Region Within the Colorado Front Range
K.M. Steinmann1, M.E. McCabe1, J.F.J. Calahorrano2, A. Sullivan2, I.B. Pollack2, E.V. Fischer2 and D.R. Caulton1
1University of Wyoming, Laramie, WY 82071; 307-766-3245, E-mail: ksteinma@uwyo.edu
2Colorado State University, Department of Atmospheric Science, Fort Collins, CO 80523
Agriculture and oil and natural gas (ONG) production are two of the largest sources of methane (CH4) emissions in the U.S and are often found near each other, like in the northern Colorado Front Range (NCFR), making CH4 source attribution difficult. Using data from the Transport and Transformation of Ammonia (TRANS2Am) campaign, we separate CH4 emissions related to agriculture from other sources, like ONG production. Phase one of the TRANS2Am campaign consisted of 15 research flights during August 2021 over the NCFR (Figure 1 shows the flight path for RF 13). CH4, ammonia (NH3), and ethane (C2H6) concentrations were measured using the University of Wyoming King Air (UWKA) research aircraft, which circled concentrated animal feeding operations (CAFOs) housing sizable beef and dairy cattle populations. Two different approaches were used to differentiate CH4 emissions by source. The first approach removed the CH4 associated with ONG by subtracting an amount of CH4 based on the C2H6:CH4 ratio. The second approach estimates the CH4 emissions from CAFOs using multivariate regression (MVR), incorporating the NH3 concentration and NH3:CH4 ratio. These two approaches were used to calculate CH4 emissions from CAFOs sampled during the first phase of the TRANS2Am campaign. We have found that our calculated CAFO CH4 emissions are slightly higher than those of previous studies and the EPA’s National Emission Inventory estimate for beef cattle. This research shows the importance of correctly attributing CH4 emission sources to properly represent CH4 sources in inventories and to better understand the role of livestock emissions on the atmosphere and climate.
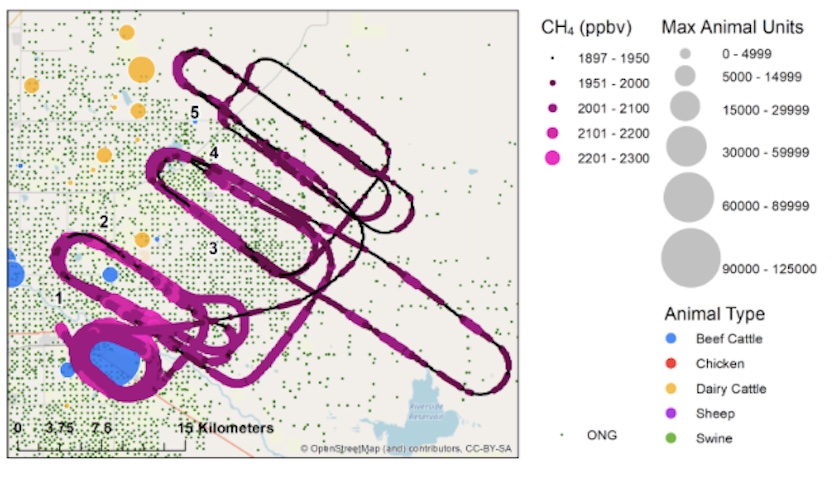
Figure 1. Path of TRANS2Am RF 13, colored by CH4 (ppbv). Black numbers represent the corresponding transect number. Animal operations are indicated by the different colored circles as in Figure 1. Green dots represent ONG wells, data of ONG as of 2015 (Colorado Department of Natural Resources Oil & Gas Conservation Commission).