
Application of BC Observations to Quantify CO and its Contribution from Fossil Fuel and Biomass Burning Fractions over the Central Himalayas
P. Srivastava1,2, M. Naja2, R. Kumar3, P. Bhardwaj3 and P.T.R. Seshadri
1National Institute for Environmental Studies, Tsukuba-City, Ibaraki, Japan; +81298502567, E-mail: srivastava.priyanka@nies.go.jp
2Aryabhatta Research Institute for observational sciences (ARIES), Department of Science and Technology (DST), Atmospheric Science Division, Govt. of India, Nainital, Uttarakhand, India
3National Center for Atmospheric Research (NCAR), Boulder, CO 80307
The continuous and simultaneous ground-based observations of carbon-based aerosols and trace gases are significantly sparse over the pristine Himalayan region while there are diverse emission sources in its adjacent plain regions. This limits source apportionment studies essential for formulating pollution mitigation and related policies. Thus, in the present work, five years (2014-18) of ground-based observations of equivalent black carbon (eBC) are used for estimating CO mixing ratios and to identify its fossil fuel and biomass emission fraction at a high-altitude (1958 m a.m.s.l) site in the Central Himalayas. CO and eBC observations are used in the multiple linear regression based (MLR) framework and it is shown that MLR does well in replicating the diurnal and monthly variations and is able to estimate CO with an r2 > 0.8 for the training period of 2014 - 2017. MLR predicted CO during 2018 closely follows the observed variations, and its mixing ratios lie within 17% of the observed CO values in any given month. Segregation shows that the COff (ff: fossil fuel) has a greater unimodal diurnal amplitude (39.1 to 67.8 ppbv) compared to CObb (bb: biomass burning) which ranges from 5.7 to 33.5 ppbv. Overall, COff is found to be the major contributor (27%) in CO after its background fraction (58%). CObb fraction is as high as 28% during spring, a period of increased agricultural and forest fires in the Northern Indian region. In comparison, the satellite and model estimates (MOPITT, MERRA2, and WRF-Chem with tracer runs) are unable to reproduce the temporal variations in CO in this region. The results thus highlight the successful applicability of MLR for CO segregation and provide the parameters for future estimation of CO from eBC. The work attempts to address the need to have continuous monitoring of CO and segregate its fossil fuel and biomass source fractions, particularly over the Himalayan area, to aid in the development of mitigation solutions for the region.
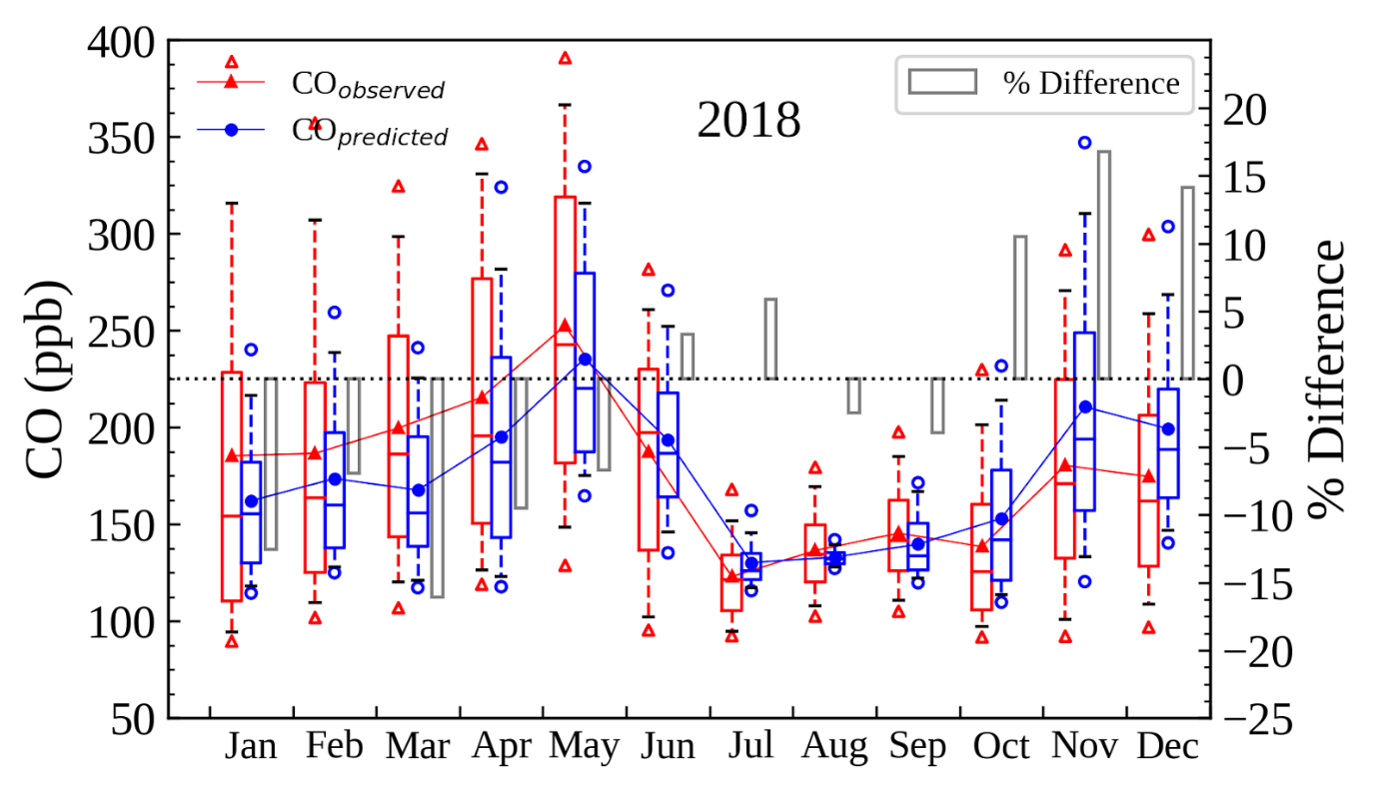
Figure 1. The monthly mean variation in observed CO and predicted CO for the year 2018. In boxplots, the lower and upper edges of the boxes represent the 25th and 75th percentiles, respectively. The whiskers below and above are the 10th and 90th percentiles and the unfilled triangles and circles depict the 5th and 95th percentiles. The solid triangles and circles inside the boxes represent the mean and the solid lines inside the boxes represent the median. The percentage difference between observed and predicted CO for the year 2018 is also shown by grey bars.