
Applications of Ethane to Methane Ratios: Identifying Abnormal Tank Emissions in the Permian Basin and Implications for Source Apportionment
D. Caulton1,1, P.D. Gurav1, A.M. Robertson1, K. Pozsonyi1, S. Murphy1 and D.R. Lyon2
1University of Wyoming, Laramie, WY 82071; 307-766-5363, E-mail: dcaulton@uwyo.edu
2Environmental Defense Fund, Austin, TX 78701
There has been increasing interest in quantifying methane (CH4) emissions from a view towards mitigation. Properly assessing which sources are emitting is an enduring challenge for the emission quantification community. The use of tracer species to identify particular sources is a promising avenue, however, our understanding of how tracers such as ethane (C2H6) vary within source categories is often limited. Lack of observational data and/or data that is not collected directly at the source are common limitations. Here, we present observations of molar ethane to methane ratios (EMRs) for different oil and natural gas (ONG) components in the Permian Basin.
Ground-based sampling of oil and gas production sites in the Permian Basin was carried out in January and October 2020. The 100 EMR observations were not normally distributed (Fig. 1) leading to three statistics that could be used for source attribution: median 14 (±1)%, arithmetic mean 27 (±6)%, and geometric mean 18 (±2)%. We compared these statistics to a regional regression of background CH4 and C2H6 and found that the geometric mean best represented the data. Using the correct statistic is critical for tracer-based attribution methodology.
Source specific EMRs showed that sites where emissions were attributed to a tank produced much higher EMRs averaging 47%. Sites with other noticeable sources such as compressors, pneumatics, and separators had lower and less variable EMRs. Tanks displayed distinct behavior with EMRs between 10-21% producing CH4 emissions >30x higher than tanks with EMRs >21%. This observation supports the hypothesis that high emission rate tank sources are often caused by separator malfunctions that leak produced gas through liquids storage tanks.
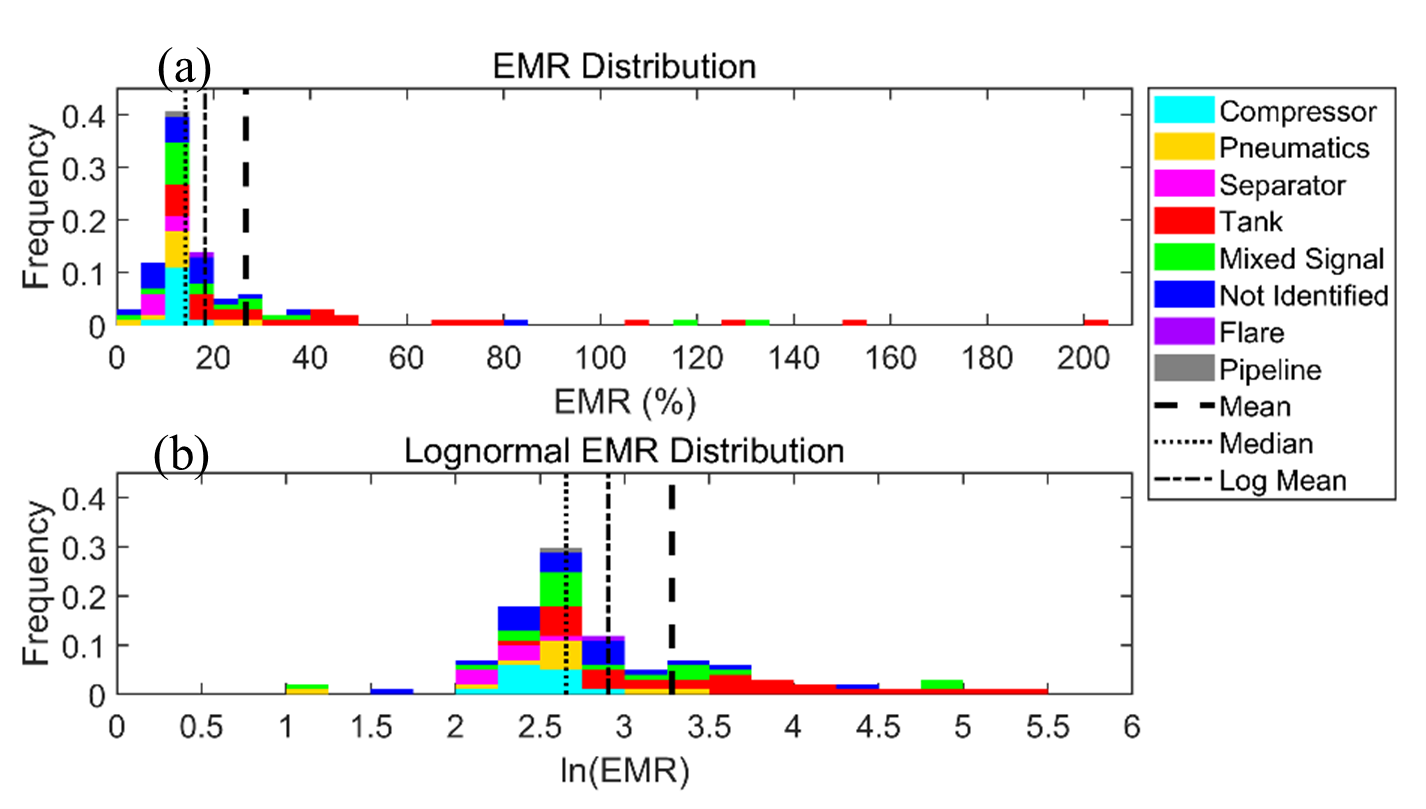
Figure 1. Figure 1. EMR distribution
Distribution of EMRs on (a) normal and (b) lognormal axes. Colors represent the contribution to each bin from the specific source type. Also shown are the arithmetic mean (black dash), median (black dot) and geometric mean (black dot/dash) lines.