
Trends in CO2, CH4, N2O, SF6
Trends in Atmospheric Nitrous Oxide (N2O)
Global N2O Monthly Means
| February 2026: | 339.75 ppb |
| February 2025: | 338.53 ppb |
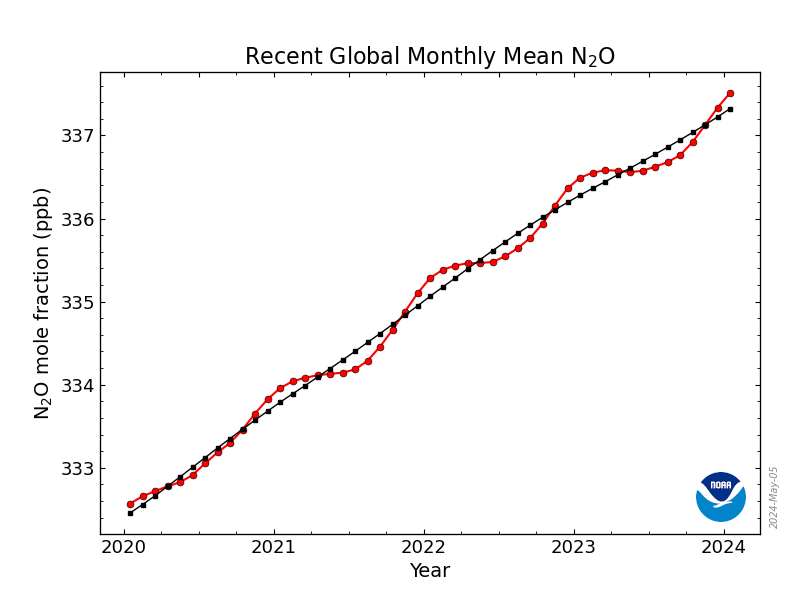
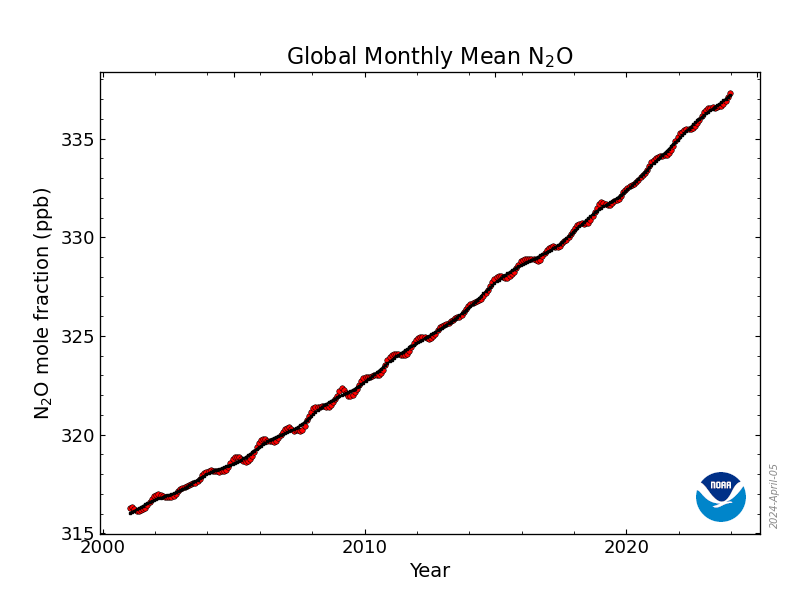
The graphs show globally-averaged, monthly mean atmospheric nitrous oxide abundance determined from marine surface sites. The first graph shows monthly means for the last four years plus the current year, and the second graph shows the NOAA time-series starting in 2001, when we have confidence in the data. Values for the last year are preliminary pending recalibrations of standard gases and other quality control steps. Other impacts on the latest few months of data are described below.
The Global Monitoring Laboratory has measured nitrous oxide since 1997 at a globally distributed network of air sampling sites (Dlugokencky et al., 1994). A global average is constructed by first smoothing the data for each site as a function of time, and then smoothed values for each site are fitted as a function of latitude at 48 equally-spaced time steps per year. Global means are calculated from the latitude fits at each time step (Masarie and Tans, 1995). Go here for more details on how global means are calculated.Nitrous oxide is reported as a “dry air mole fraction”, defined as the number of molecules of nitrous oxide divided by the total number of molecules in the sample, after water vapor has been removed. The mole fraction is expressed as nmol mol-1, abbreviated “ppb” (for parts per billion; 1 ppb indicates that one out of every billion molecules in an air sample is N2O).
In the figures, the red lines and circles are globally averaged monthly mean values centered on the middle of each month. The black line and squares show the long-term trend (in principle, similar to a 12-month running mean) where the average seasonal cycle has been removed.
Annual Increase in Globally-Averaged Atmospheric Nitrous Oxide
| Year | Growth (ppb) | Uncertainty (ppb) |
|---|---|---|
| 2001 | 0.71 | 0.13 |
| 2002 | 0.50 | 0.13 |
| 2003 | 0.80 | 0.14 |
| 2004 | 0.53 | 0.16 |
| 2005 | 0.87 | 0.14 |
| 2006 | 0.69 | 0.16 |
| 2007 | 0.90 | 0.14 |
| 2008 | 0.92 | 0.15 |
| 2009 | 0.76 | 0.16 |
| 2010 | 1.08 | 0.16 |
| 2011 | 0.91 | 0.14 |
| 2012 | 0.81 | 0.14 |
| 2013 | 1.01 | 0.16 |
| 2014 | 1.24 | 0.13 |
| 2015 | 0.90 | 0.15 |
| 2016 | 0.66 | 0.15 |
| 2017 | 1.02 | 0.15 |
| 2018 | 1.16 | 0.14 |
| 2019 | 0.90 | 0.13 |
| 2020 | 1.32 | 0.12 |
| 2021 | 1.29 | 0.02 |
| 2022 | 1.24 | 0.01 |
| 2023 | 1.01 | 0.02 |
| 2024 | 1.02 | 0.02 |
| 2025 | 1.24 | 0.12 |
The table summarizes annual increases in atmospheric N2O based on globally averaged marine surface data.
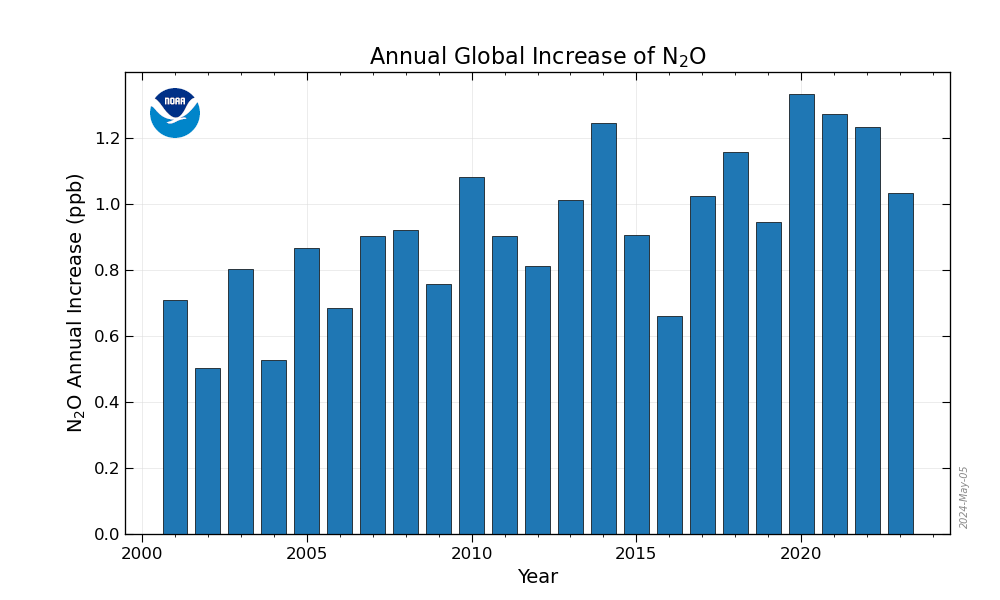
The annual increase in atmospheric N2O in a given year is the increase in its abundance (mole fraction) from January 1 in that year to January 1 of the next year, after the seasonal cycle has been removed (as shown by the black lines in the figure above). It represents the sum of all N2O added to, and removed from, the atmosphere during the year by human activities and natural processes. Our first preliminary estimate for the annual increase of a particular year is reported in April of the following year, using available data from the previous year. It is important to recognize that the initial, April estimate of the annual increase is likely to change significantly as more data are added to the analysis. That estimate will be updated in subsequent months as more samples are measured for N2O and included in the analysis. By autumn of the following year the annual increase will typically converge toward a “final” value.
Estimates of the globally-averaged N2O abundance (monthly- and annually-averaged means), and the annual increase, are updated every month as new samples are returned to Boulder, measured for N2O, and added to the analysis. Adding new, more recent data improves the accuracy of the initial estimate by increasing the spatial density of data and eliminating “end effects” of the curve fitting procedures used. We’ve investigated the impacts of adding new data to the parameters reported here, and a summary of the results follows:
Initial estimates of the N2O annual increase made for the previous year are biased compared to those that follow using additional data. The average bias in the initial estimate is +0.12±0.08 ppb yr-1 (1 standard deviation shown). Over the next few months, the average bias slowly decreases until it is negligible by July or August. In any given year though, bias in the initial estimate of the annual increase can be much larger than the average, with bias up to ±0.25 ppb yr-1; that is, it can be positive or negative. In other words, until late in a year, bias in the annual increase can be much larger than the uncertainty reported based on the bootstrap method described below.
Behavior of initial annually-averaged means and monthly-averaged means are similar (see links to files below). For monthly mean N2O, the initial value is typically too large, by up to 0.4 ppb.
The estimated uncertainty in the global annual N2O increase varies by year. It is estimated using two terms: The first is a "bootstrap" (resampling) method that varies the sites in our network. Each bootstrap realization of the network is constructed by randomly picking sites, with restitution, from the existing marine boundary layer sites in the NOAA/GML cooperative global air sampling network (Dlugokencky et al., 1994). Each member of the ensemble of networks has the same number of sites as the real network, but some sites are missing, while others are repeated. An additional condition is that at least one site is present from high southern latitudes, one from the tropics, and one from high northern latitudes, because we have always maintained broad latitude coverage in the real network. Temporal data gaps at individual sites are present in the bootstrap networks. The second term is a Monte Carlo method that randomly modifies the data to account for measurement uncertainty. The modifications are based on assessment of random uncertainty and potential systematic bias in the measurements, and it varies over time. In both cases, 100 globally-averaged time series are created. We calculate the mean and standard deviation for each year's annual increase from the ensemble members, and one standard deviation from the two terms (network and analytical) is taken in quadrature to give the reported uncertainty at each time step. As mentioned earlier, bias in our first estimates of annual increase, monthly mean, and annual mean can be significantly greater than the stated uncertainty.
Data
The complete globally averaged N2O records described on this page are available.-
 Globally averaged marine surface monthly mean data (text)
or
(CSV)
Globally averaged marine surface monthly mean data (text)
or
(CSV)
-
Globally averaged marine surface annual mean data (text)
or
(CSV)
-
Globally averaged marine surface annual mean growth rates (text)
or
(CSV)
How to reference content from this page
- Lan, X., K.W. Thoning, and E.J. Dlugokencky: Trends in globally-averaged CH4, N2O, and SF6 determined from NOAA Global Monitoring Laboratory measurements. Version 2026-06, https://doi.org/10.15138/P8XG-AA10
Contact
- Xin Lan, NOAA/GML, xin.lan@noaa.gov
Further Reading
- Dlugokencky, E. J., L. P. Steele, P. M. Lang, and K. A. Masarie (1994), The growth rate and distribution of atmospheric methane, J. Geophys. Res., 99, 17,021– 17,043, doi:10.1029/94JD01245.
- K.A. Masarie and P.P. Tans, (1995), Extension and integration of atmospheric carbon dioxide data into a globally consistent measurement record, J. Geopys. Research, vol. 100, 11593-11610