
Barrow Snowmelt Date
NOAA Earth System Research Laboratory, R/GML, 325 Broadway, Boulder, CO 80305-3328
Robert Stone, Science and Technology Corporation, Boulder, CO
Updated March 2017
ACKNOWLEDGEMENTS: This study was initially supported by NOAA's Earth System Research Laboratory's (ESRL) Global Monitoring Division (GMD), the International Arctic Research Center (IARC) and the Cooperative Institute for Arctic Research (CIFAR) - University of Alaska. We also wish to thank G. Divoky, J. Foster, C. George, D. Kane, G. Maykut, R. McClure, and T. Zhang for providing various data sets.
NOTE: In 2017, a new page, with updated time series and additional content, was posted at:
Barrow's Annual Snow Cycle; Ecological Responses to a Lengthening Snow-free Season
Background
To understand global climate change more fully it is necessary to assess the variability of earth's cryosphere in response to other climatic factors. In particular, the timing of the disappearance of snow each year, referred to as the snowmelt date, can influence the net energy budget for an entire season. Feedbacks involving the change in surface albedo may enhance or diminish any response, which may be manifested in the regional temperature regime. At the National Weather Service (NWS) station in Barrow the date of snowmelt has been derived from snow depth observations since the late 1940s. Since the mid 1980s, at the NOAA/GML Barrow Observatory (BRW) a determination the snowmelt date has been made using radiometric measurements made over open tundra. This is illustrated in Figure 1, which shows a typical annual cycle of the solar, or shortwave (SW), components of the net radiation balance on a daily average basis and also the derived surface albedo.
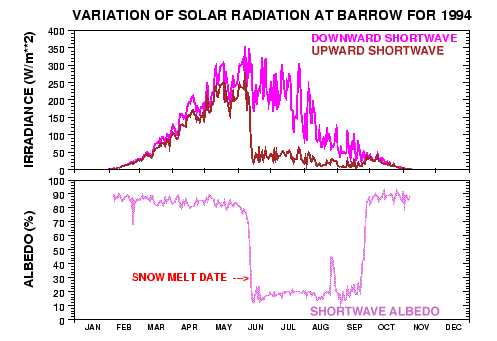
NOAA has selected a threshold of 0.30 or 30% albedo, the ratio of upward-to-downward SW irradiance, as a good indicator of final melt-out. The date is determined to be that of the first daily average below 30%. Once this occurs each spring, albedo seldom increases again until autumn, except for an occasional late snowfall of brief duration that can occur anytime throughout the summer as is evidenced in Figure 1. What is remarkable is that this annual event typically occurs over only a few days as Figure 1 indicates. However, snow disappearance date each spring is highly variable from year to year, which in turn can influence the annual energy budget quite significantly. More recent examples of the annual cycle and a net surface radiation climatology for 1993-2016 are presented at: Barrow's Annual Snow Cycle; Ecological Responses to a Lengthening Snow-free Season; Figure 1.
The timing of seasonal snowmelt at high latitudes is potentially one of the most important but least understood processes that affects global climate through the "temperature - albedo feedback". Any long-term, regional trend in the distribution and melt of the snowpack may be interpreted as a manifestation of climate change. Therefore, we are examining the history of the Barrow snowmelt date in great detail to understand why it varies and to determine if it is occurring earlier in response to global warming. Recent investigations have focused also on the date of snow-in during the autumn transition, determined by the date when albedo is sustained above 60%. Ancillary analyses on how the resulting length of the snow-free season impacts regional phenology, permafrost temperatures and biogeochemical cycles are also being conducted.
NOTE; the following pages build upon a study completed in the late 1990's, updated in 2009, and again in 2011. The more recent analyses are presented on a separate page, at: Barrow's Annual Snow Cycle; Ecological Responses to a Lengthening Snow-free Season
Historical Snowmelt Time Series
Foster (1989) claimed that the disappearance of snow in spring at Barrow showed a trend manifested by a progressively earlier melt since the 1950s, speculating that this was an indication of global warming. Dutton and Endres (1991), however, took issue with Foster's conclusion, suggesting that the apparent trend was, in large part, attributable to local urbanization effects. Their argument was based on more objective, radiometric measurements made over the open tundra, upwind of Barrow at the NOAA/ESRL Observatory (BRW). These were confirmed not to be influenced by urban effects, but the analysis was based on only a few years of overlapping data.
The issue is revisited in Figure 2, which shows the respective time series updated through 1996. By 1990, it appeared that the radiometric estimates of the snowmelt date at BRW were also tending to occur earlier then previous years. Moreover, there is fair temporal correlation between the two independent observations giving credence to both data records in terms of inter-annual variability. It was hypothesized that earlier melting of the snow pack, on average, each spring may result from a) less than normal accumulation of snow throughout the winter months, b) warmer spring temperatures that accelerates ablation/melt or c) a combination of a and b.
![[GRAPH AS DESCRIBED BELOW]](graphics/melthist.gif)
Evidence of a Regional Trend in the Date of Snow disappearance on the North Slope of Alaska
Figure 3a shows time series of melt dates and proxy observations from six other North Slope sites that are correlated with the 1966-2000 BRW record. The locations of these sites are indicated on the map, Figure 3b. Yearly data were analyzed to determine trends and correlation coefficients, but only 5-year-smoothed data are presented. The Sagwon SAG (69.4°N, 148.8°W; elev. 351 m) and Franklin Bluffs FBF (69.9°N, 148.1°W; elev. 76 m) melt dates were determined using a 0.30 albedo threshold (e.g., Figure 1). Both sites are within the Kuparuk River Watershed located southeast of Barrow. Barter Island BTI (70.1°N, 143.6°W; elev. 15 m) was another NWS station where, until 1987, melt dates were determined from snow depth data. The series labeled satellite SAT was derived from visible satellite images of a strip of tundra about 150 km south of Barrow, Alaska Foster et al., 1992. The upper two curves in Figure 3a are proxy records. Cooper Island CPI (71.7°N, 155.7°W; elev. 3 m) is a time series of dates when a species of Arctic bird, the Black Guillemot, first lays an egg. Each spring Guillemots nest on the island but only after the snow melts and they have access to nest cavities do they breed, producing their first clutch of eggs about two weeks later. Isaktoak ISK (71.3°N, 156.8°W) is a time series of dates when ice has melted completely off of the Isaktoak Lagoon, which is located in the village of Barrow. These proxy records are correlated with the BRW time series suggesting that snowmelt and ice melt are influenced similarly by variations in climate.
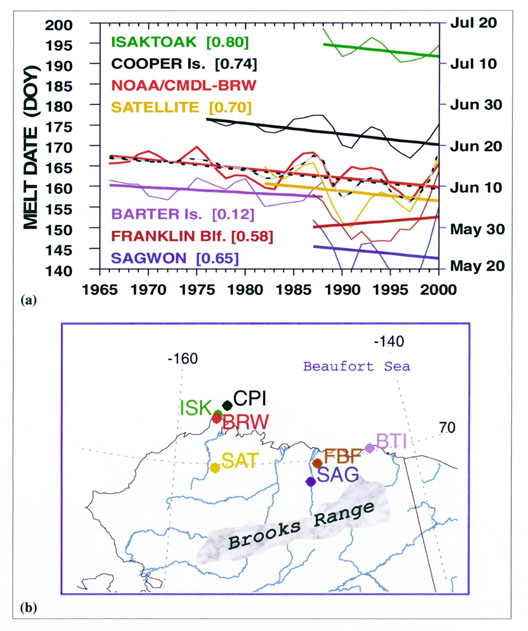
The dashed curve in Figure 3a represents an ensemble average of all observations normalized to the average timing of the BRW melt date. A linear fit of this 142 station-year record shows an advance in the spring melt of 8.0 days over 35 years ± 4.0 at a confidence level of 95%. However, the correlated variations of time series shown in Figure 3a are more indicative of climatic shifts than of a monotonic change. Note also that the melt tends to progress from the more southerly locations of the Kuparuk River Watershed, northward toward the coast (e.g., Barter Is.), and last in the vicinity of Barrow. Also, the dates of snow disappearance at all sites were moderately late in 1999 and 2000 and again in 2001 (not shown) indicating a recent shift in the conditions or factors that influence the timing of the spring melt in northern Alaska. These factors, which include snowfall amounts, temperatures, and sky cover that vary with synoptic conditions are discussed in Stone et al. (2001 and 2002).
Update - 2009; Long-term trend in the record of snow melt date at the NOAA/ESRL Barrow Observatory
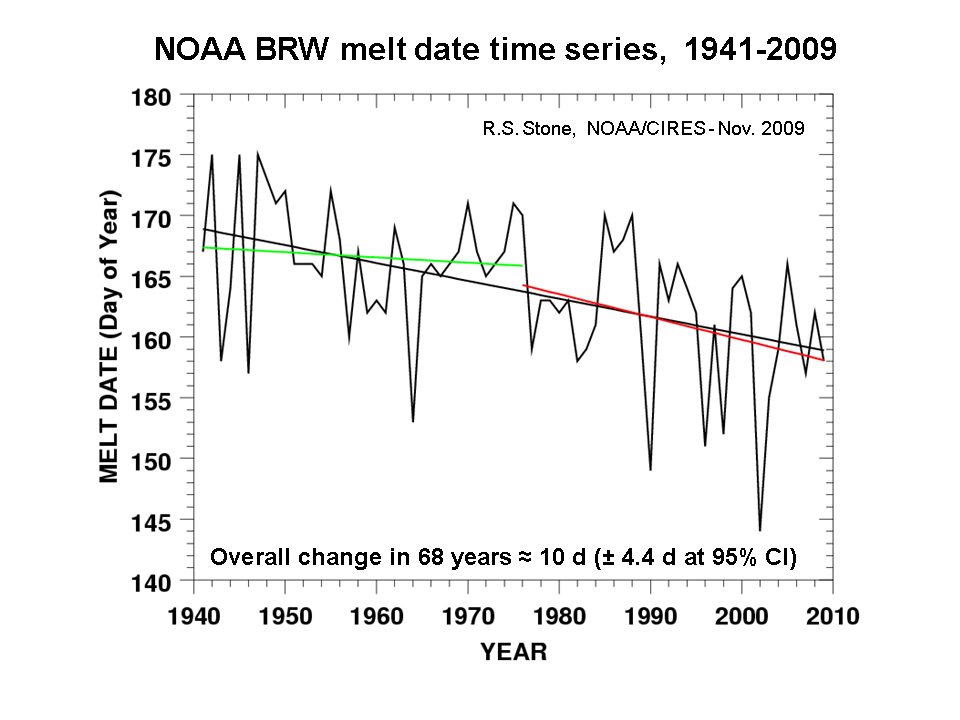
Figure 4 updates the BRW snow melt record of Stone et al. (2002) (Fig.3a), adding nine years to the time series. The long-term trend has been re-evaluated, and shows an advance of about 10 days over the 68-year period. Regression analyses for the periods prior to and after 1977 show clearly that the advance occurred mostly since the mid 1970s, coinciding with a major shift in atmospheric circulation that occurred in the North Pacific beginning in 1976 (Stone et al., 2005). A record set in 2002, followed by another early melt in 2003 sustained the trend, while some recovery is indicated in subsequent years. Analyses of factors that underlie these variations and potential linkages to the declining sea ice north of Alaska are ongoing at ESRL.
Click on image to view full size figure.
Update - 2011; Response of black guillemots to the date of snow melt on Cooper Island
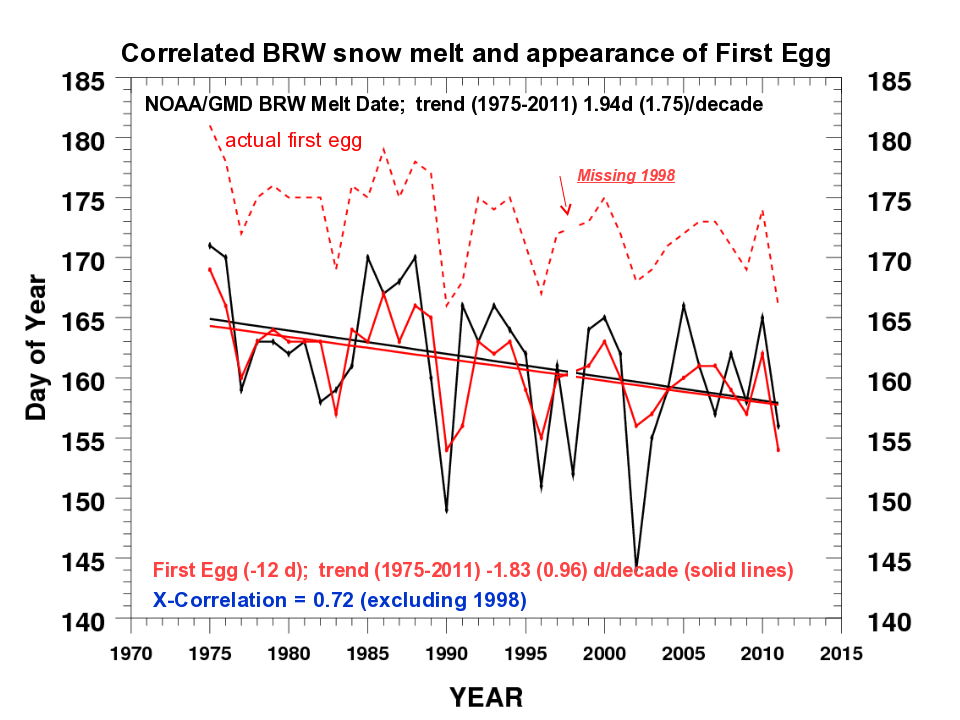
Figure 5 updates the overlapping time series of the annual disappearance of snow at BRW and the date of the appearance of the ‘first egg’ laid by black guillemots that migrate to Cooper Island (see Fig. 3a above and also Stone et al. (2002) (Fig.3a). The long-term trend has been re-evaluated for the period 1975 through 2011, excluding 1998. Black guillemots cannot nest until the snow on the island has melted, then produce eggs 11-13 days after the melt at BRW. Their habits and long record of observation by George Divoky are described at: https://www.cooperisland.org/.
Click on image to view full size figure.
Please go to: Barrow's Annual Snow Cycle; Ecological Responses to a Lengthening Snow-free Season for updates to the analyses presented above.
References
- Dutton, E. G. and D. J. Endres 1991, Date of snow melt at Barrow, Alaska, USA, Arctic and Alpine Research, 23,(1), p.115-119
- Foster, J. L. 1989, The significance of the date of snow disappearance on the arctic tundra as a possible indicator of climatic change, Arctic and Alpine Research, 21,(1), p. 60-70
- Foster, J. L., J.W. Winchester, and E.G. Dutton, 1992, The date of snow disappearance on the Arctic tundra as determined from satellite, meteorological station and radiometric in situ observations, IEEE Transactions on Geoscience and Remote Sensing, 30(4), 793-798.
-
 Stone, R., T. Mefford, E. Dutton, D. Longenecker, B. Halter and D. Endres. 1996,
Surface radiation and meteorological measurements: January 1992 to December 1994.
NOAA Data Report ERL-CMDL-11, 81pp.
Stone, R., T. Mefford, E. Dutton, D. Longenecker, B. Halter and D. Endres. 1996,
Surface radiation and meteorological measurements: January 1992 to December 1994.
NOAA Data Report ERL-CMDL-11, 81pp.
- Stone , R.S., E.G. Dutton, J.M. Harris, and D. Longenecker 2001, THE ADVANCING DATE OF SPRING SNOWMELT IN THE ALASKAN ARCTIC, Proceedings of the Eleventh Atmospheric Radiation Measurement (ARM) Science Team Meeting, March 19-23, 2001, Atlanta, Georgia.
- Stone, R. S., E. G. Dutton, J. M. Harris, and D. Longenecker 2002, Earlier spring snowmelt in northern Alaska as an indicator of climate change, J. Geophys. Res., 107(D10), 4089, doi:10.1029/2000JD000286;
- Stone, R., D. Douglas, G. Belchansky, and S. Drobot 2005, Correlated declines in Pacific Arctic snow and sea ice cover, Arctic Research of the United States, Vol. 19, pp18-25;
Related Links
- Barrow Radiation Climatology
- Pinatubo effects in the Arctic
- Western Arctic Climate Change
- The Cooperative Institute for Arctic Research
- International Arctic Research Center