Interactive Figures
Many of the figures on the US Potent GHG Tracker website are created with the Altair Python module. Altair is a declarative statistical visualization library, based on Vega and Vega-Lite, and the source is available on GitHub.
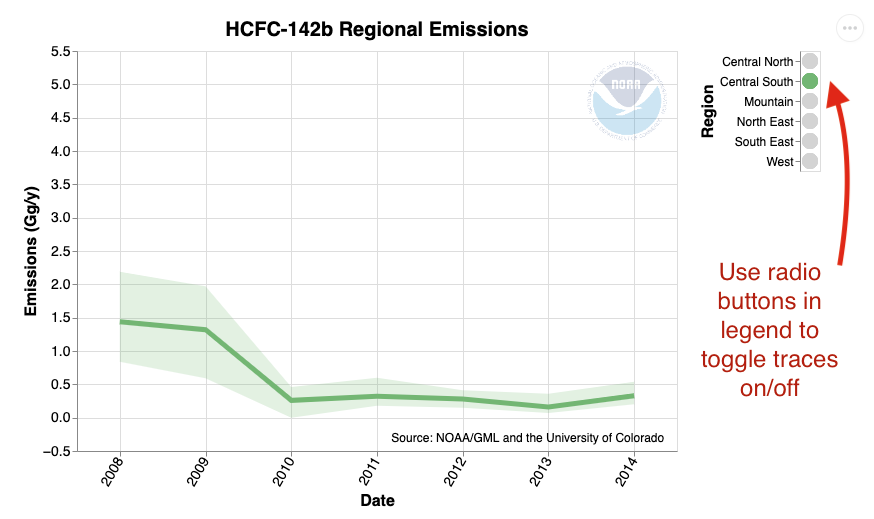
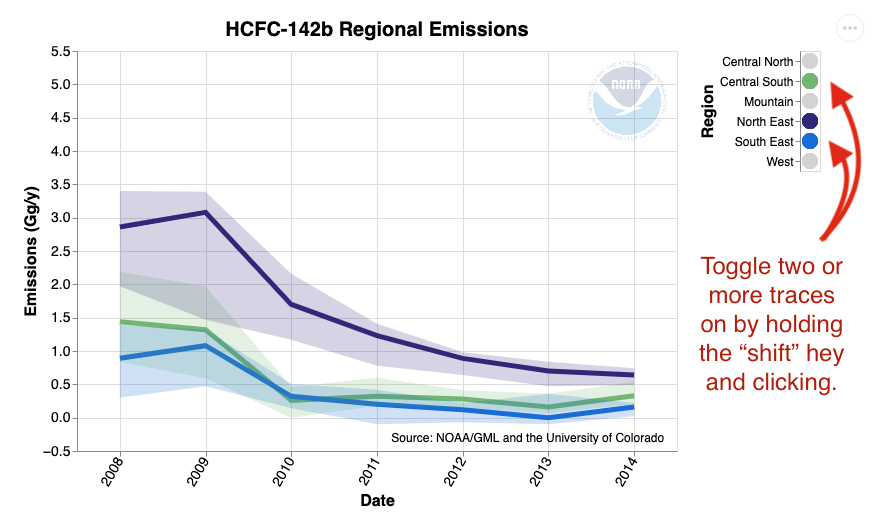
Some of the figures are interactive where traces can be toggled on or off by clicking the radio buttons in the legend. To toggle two or more traces on, hold the shift key while clicking the legend buttons. Double click your mouse on the figure to return it to the default view.
Saving a Figure
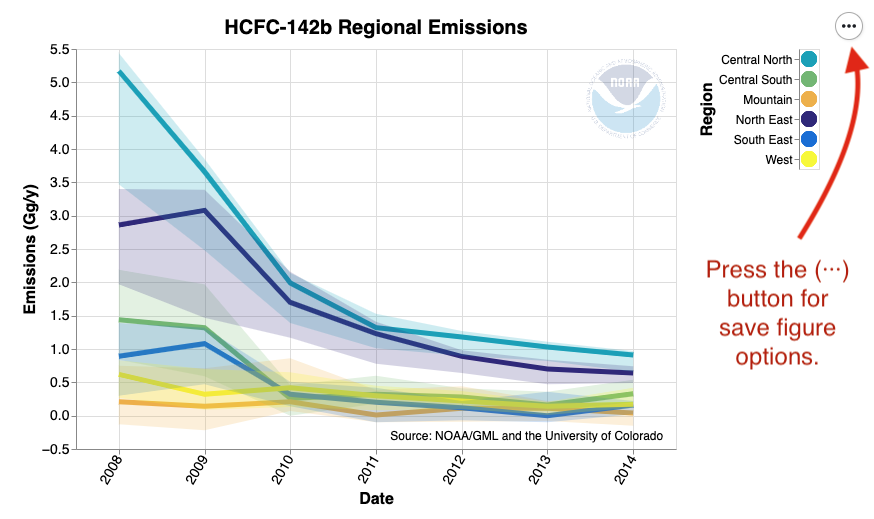
Images can also be saved in PNG or SVG format by clicking the button with three dots in the upper right corner of the figure.