
The U.S. government is closed. This site will not be updated; however, NOAA websites and social media channels necessary to protect lives and property will be maintained.
To learn more, visit commerce.gov.
For the latest forecasts and critical weather information, visit weather.gov.
Chromatograph for Atmospheric Trace Species
Nitrous Oxide (N2O) Mixing Ratio
South Pole, Antarctica
Links to data files: Hourly, Daily, Monthly, Global
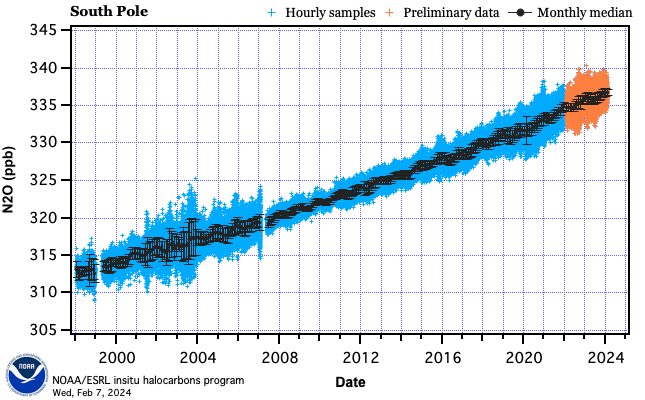
The figure above shows the hourly individual in situ measurements and the calculated monthly median. Error bars displayed on the monthly median data are a 1-σ measure of the instrument's precision and should not be confused with atmospheric variability.
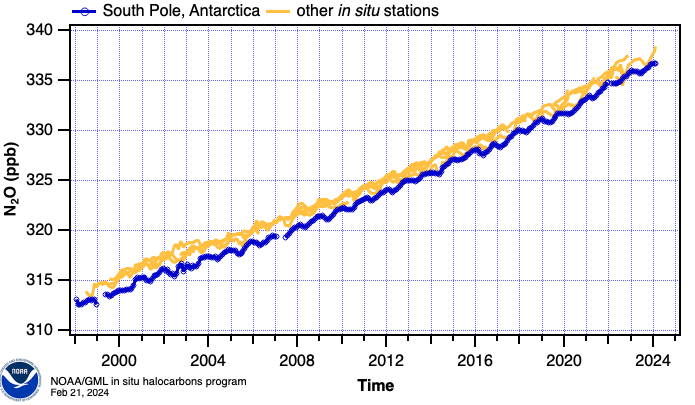
The global distribution of Nitrous Oxide
measured by the in situ halocarbons program is displayed above
and is compared to monthly medians measured at South Pole, Antarctica.

Hemispheric and global means estimated from the in situ halocarbons program.