
Information
Home FAQ Project Goals Documentation Collaborators TutorialResults
Fluxes Observations Evaluation Visualization DownloadGet Involved
Suggestions E-mail List Contact UsResources
How to Cite Version History Glossary References BibliographyCH4 Maps (CarbonTracker-CH4)
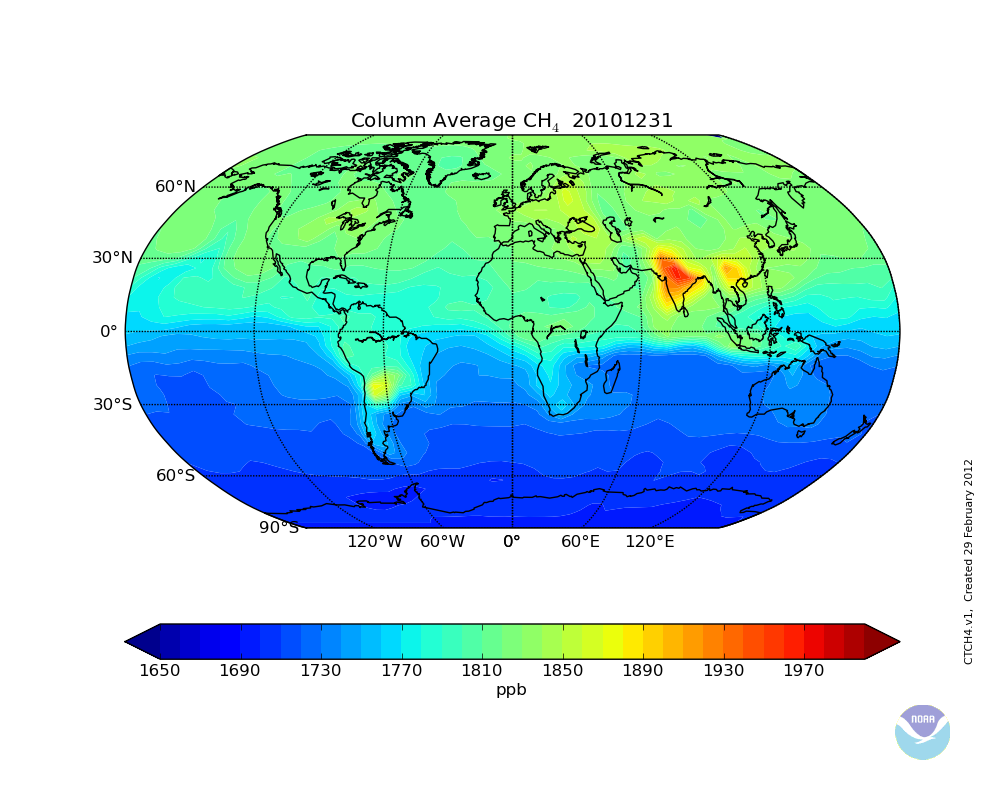 Column Average CH4 Daily
average of the pressure-weighted mean mole fraction of methane
simulated by CarbonTracker-CH4. Units are
nanomoles of CH4 per mole of dry air
(nmol mol-1), and the values are given by
the color scale depicted under the graphic.
Gradients in CH4
concentration are due to exchange between the atmosphere
and the earth surface, including fossil fuel emissions, emissions from
agriculture and waste, wildfire emissions, and emissions from wetlands.
These gradients are subsequently
transported by weather systems, even as they are gradually erased by
atmospheric mixing.
Column Average CH4 Daily
average of the pressure-weighted mean mole fraction of methane
simulated by CarbonTracker-CH4. Units are
nanomoles of CH4 per mole of dry air
(nmol mol-1), and the values are given by
the color scale depicted under the graphic.
Gradients in CH4
concentration are due to exchange between the atmosphere
and the earth surface, including fossil fuel emissions, emissions from
agriculture and waste, wildfire emissions, and emissions from wetlands.
These gradients are subsequently
transported by weather systems, even as they are gradually erased by
atmospheric mixing.
Click here to see animations of simulated CarbonTracker CH4.