


Trends in CO2, CH4, N2O, SF6

Trends in Atmospheric Carbon Dioxide (CO2)
Recent Global CO2 Trend
| October 21: | 428.07 ppm |
| October 20: | 428.06 ppm |
| October 19: | 428.05 ppm |
| October 18: | 428.05 ppm |
| October 17: | 428.04 ppm |
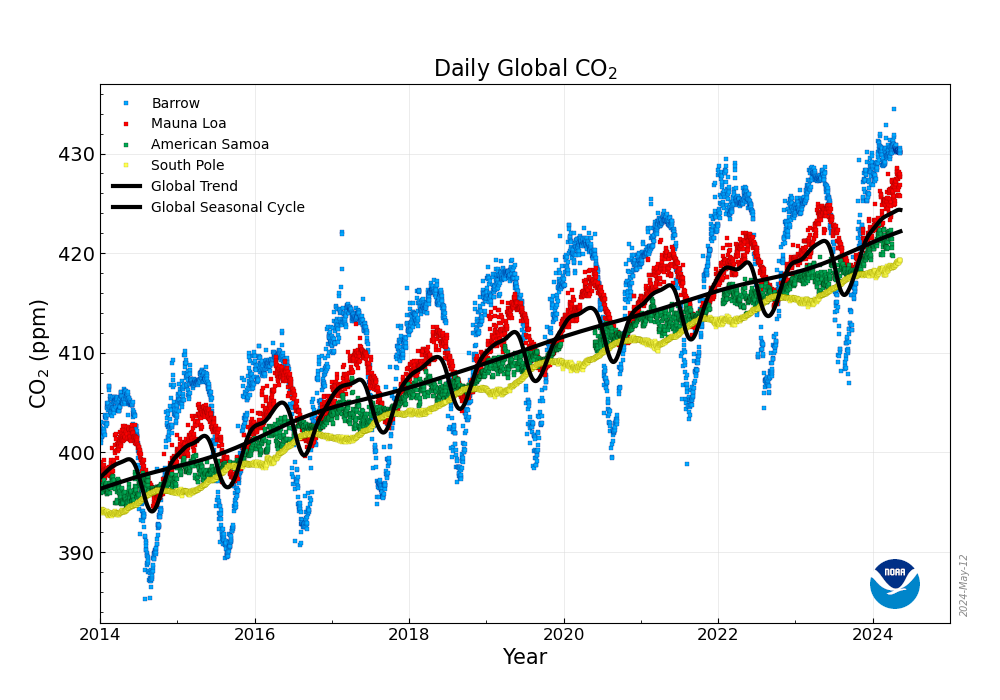
The figure shows daily averaged CO2 from four GML Atmospheric Baseline observatories; Barrow, Alaska (in blue), Mauna Loa, Hawaii (in red), American Samoa (in green), and South Pole, Antarctica (in yellow). The thick black lines represent the average of the smoothed seasonal curves and the smoothed, de-seasonalized curves for each of the records. These lines are a very good estimate of the global average levels of CO2. Details about how the smoothed seasonal cycle and trend are calculated from the daily data are available here.