
OCO-2 B10 signal analysis
The OCO-2 "signal" is defined as gridded 10-second-average OCO-2 B10 retrievals minus a CO2 reference. All quantities are presented as column-average (pressure-weighted) CO2 dry-air mole fraction (XCO2) in parts per million (ppm), without averaging kernel corrections. The reference field for the plots on this page is composed of the mean of four different quasi-operational CO2 analyses, each of which is constrained by traditional in situ measurements:- CarbonTracker
- Jena
- MACC
- University of Edinburgh
List of figures
- Fig 1. Zonal-mean LN signal (bias corrected)
- Fig 2. Zonal-mean LN signal (un-bias-corrected)
- Fig 3. Zonal-mean LN bias correction
- Fig 4. Zonal-mean number of LN retrievals per 2°x2° cell
- Fig 5. Zonal-mean OG signal (bias corrected)
- Fig 6. Zonal-mean OG signal (un-bias-corrected)
- Fig 7. Zonal-mean OG bias correction
- Fig 8. Zonal-mean number of OG retrievals per 2°x2° cell
- Fig 9. Zonal-mean LN and OG signal (bias corrected)
- Fig 10. Zonal-mean LN and OG signal (un-bias-corrected)
- Fig 11. Zonal-mean LN and OG bias correction
- Fig 12. Zonal-mean number of LN and OG retrievals per 2°x2° cell
- Fig 13. Time-mean LN and OG signal map
- Fig 14. Time-mean number of LN and OG retrievals per 2°x2° cell
- Fig 15. Time-mean LN and OG un-bias-corrected signal map
- Fig 16. Seasonal LN and OG signal maps
- Fig 17. Seasonal number of LN and OG retrievals per 2°x2° cell, maps
- Fig 18. Seasonal OG signal maps
- Fig 19. Seasonal LN signal maps
- Fig 20. Seasonal LN and OG un-bias-corrected signal maps
- Fig 21. Time-mean changes from B9.1 to B10 LN and OG signal, maps
- Fig 22. Time-mean changes from B9.1 to B10 LN signal, maps
- Fig 23. Time-mean changes from B9.1 to B10 OG signal, maps
- Fig 24. Seasonal changes from B9.1 to B10 LN signal, six-panel maps
- Fig 25. Seasonal changes from B9.1 to B10 OG signal, six-panel maps
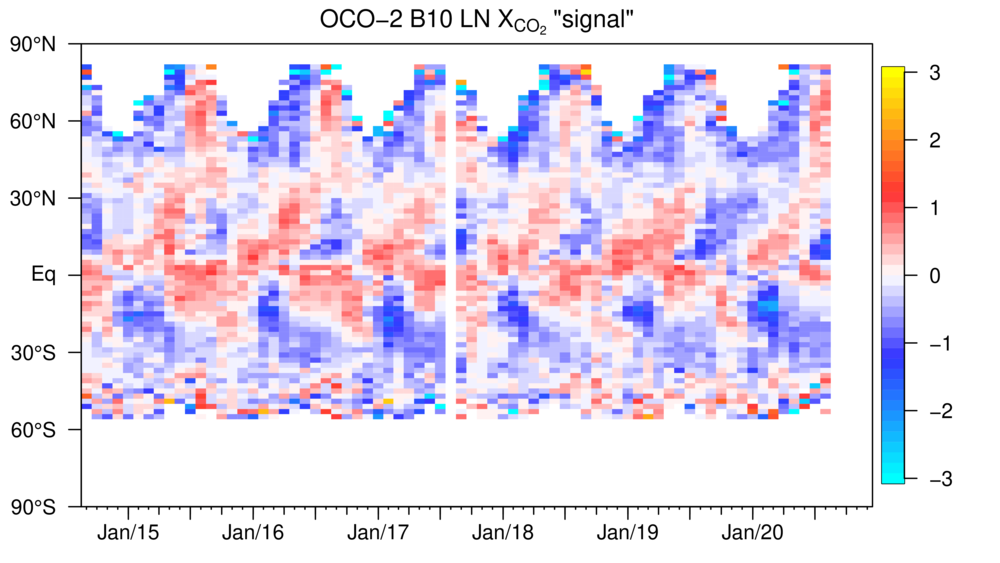
Fig 1. Zonal-mean LN signal (bias corrected)
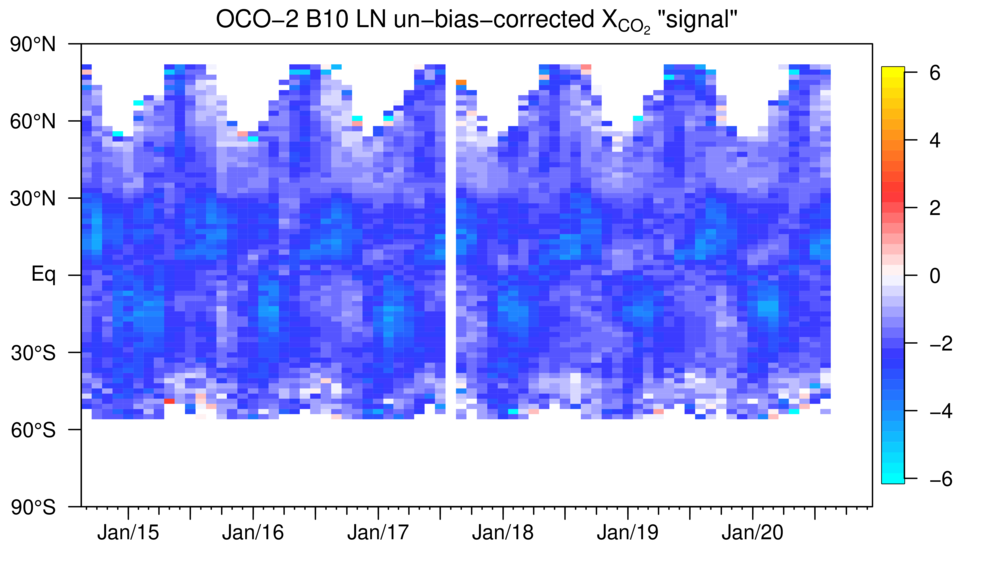
Fig 2. Zonal-mean LN signal (un-bias-corrected)
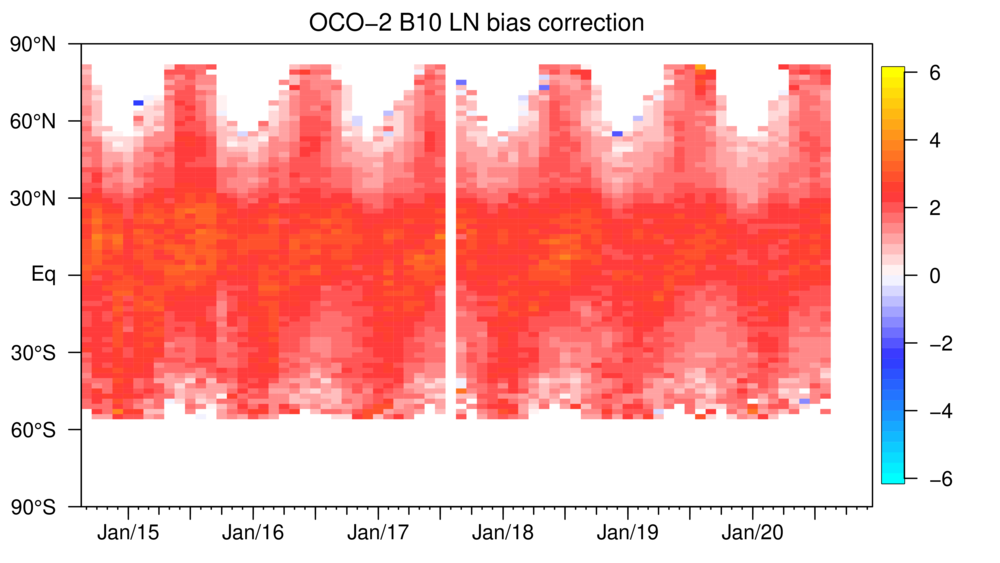
Fig 3. Zonal-mean LN bias correction
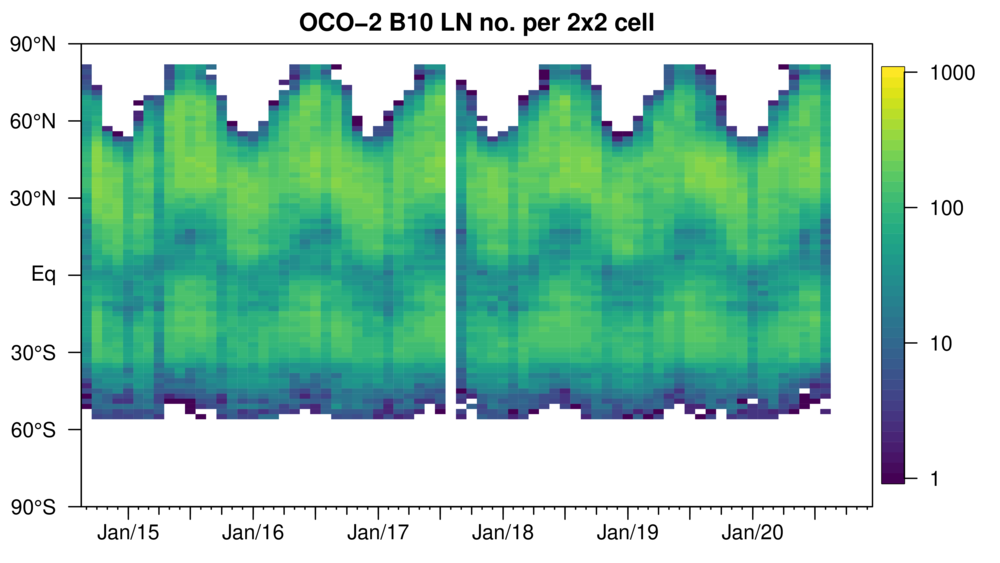
Fig 4. Zonal-mean number of LN retrievals per 2°x2° cell
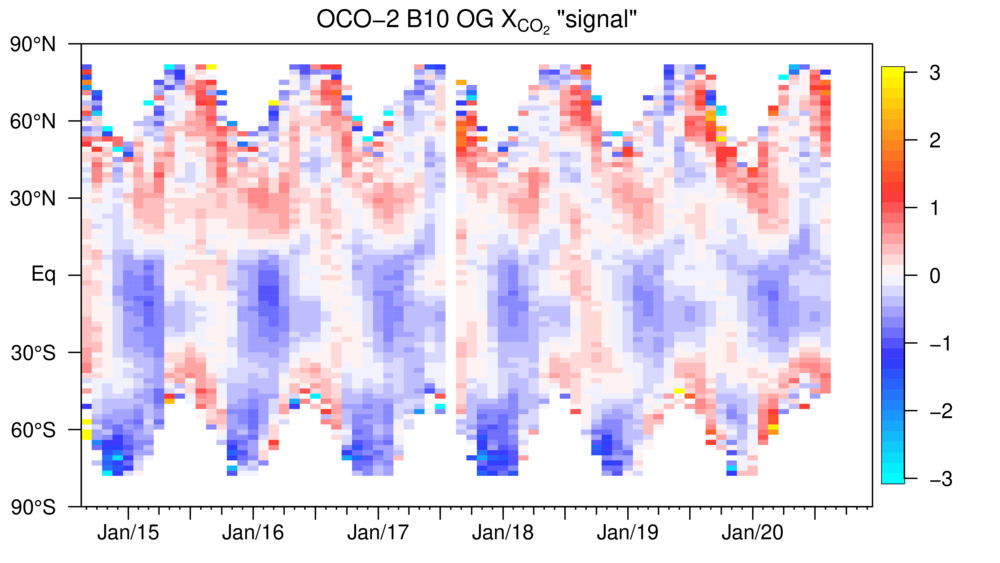
Fig 5. Zonal-mean OG signal (bias corrected)
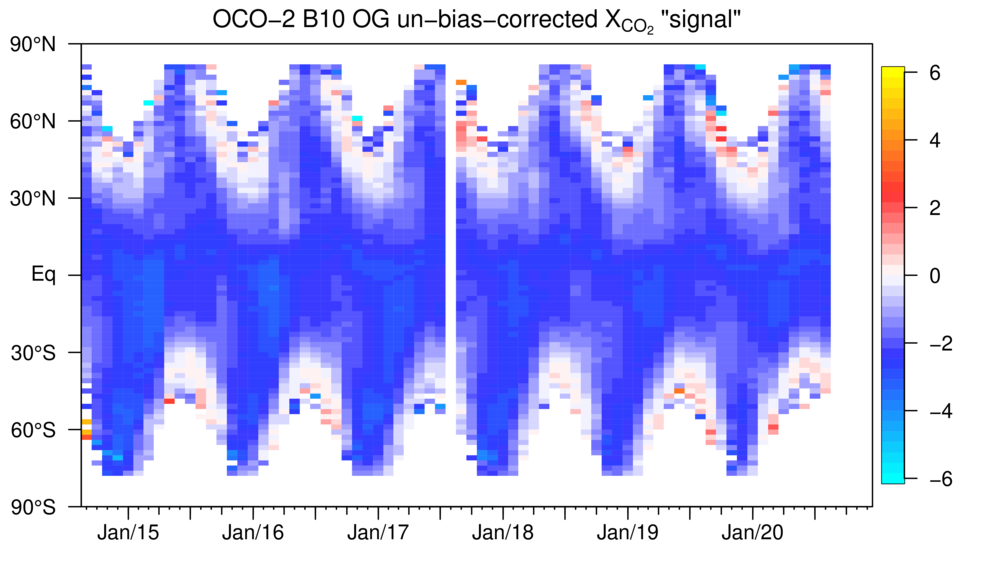
Fig 6. Zonal-mean OG signal (un-bias-corrected)
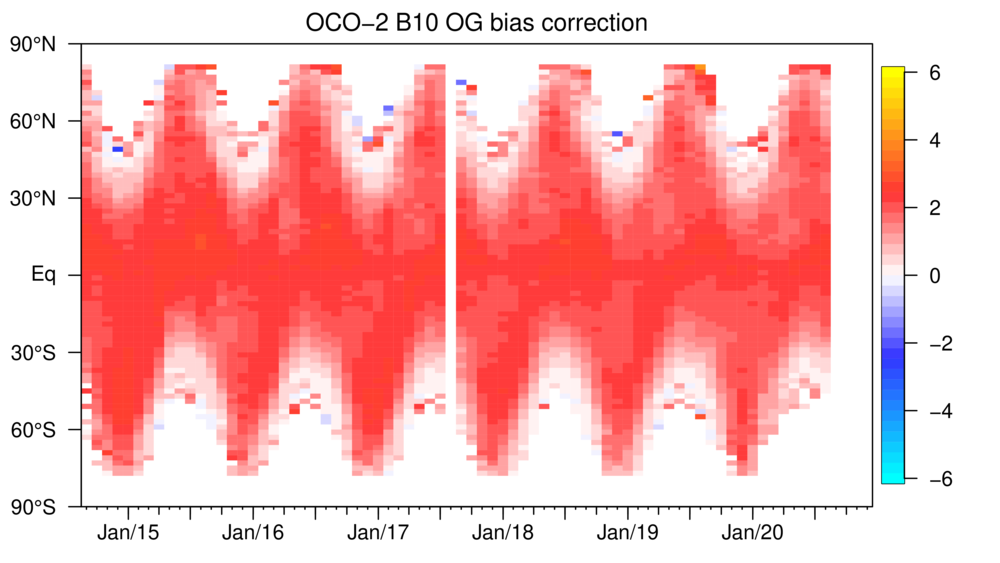
Fig 7. Zonal-mean OG bias correction
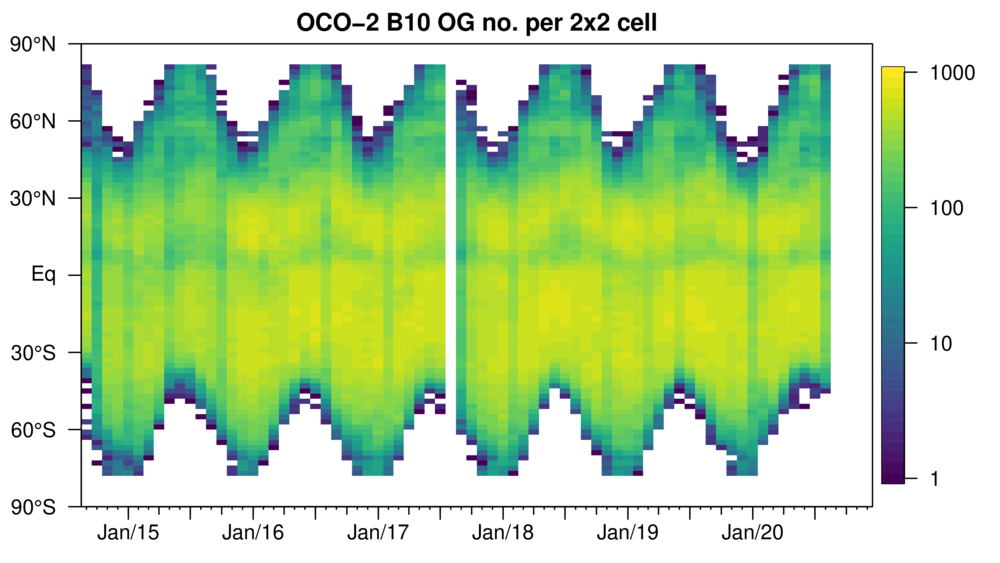
Fig 8. Zonal-mean number of OG retrievals per 2°x2° cell
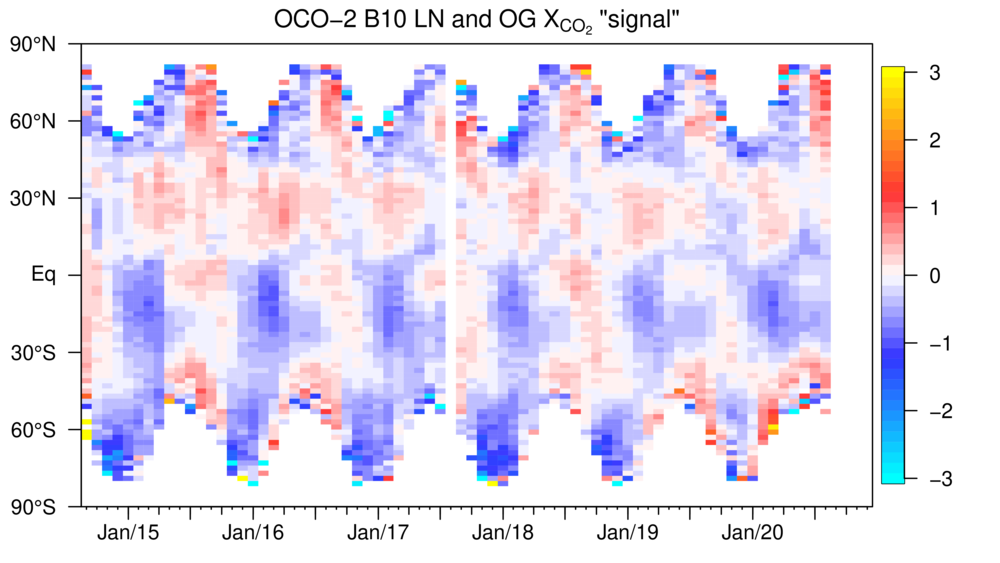
Fig 9. Zonal-mean LN and OG signal (bias corrected)
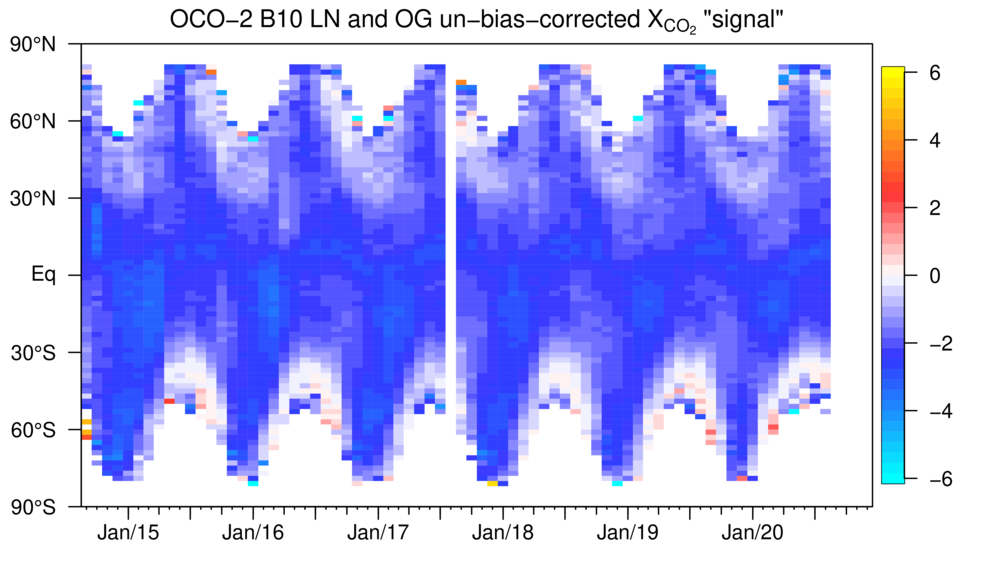
Fig 10. Zonal-mean LN and OG signal (un-bias-corrected)
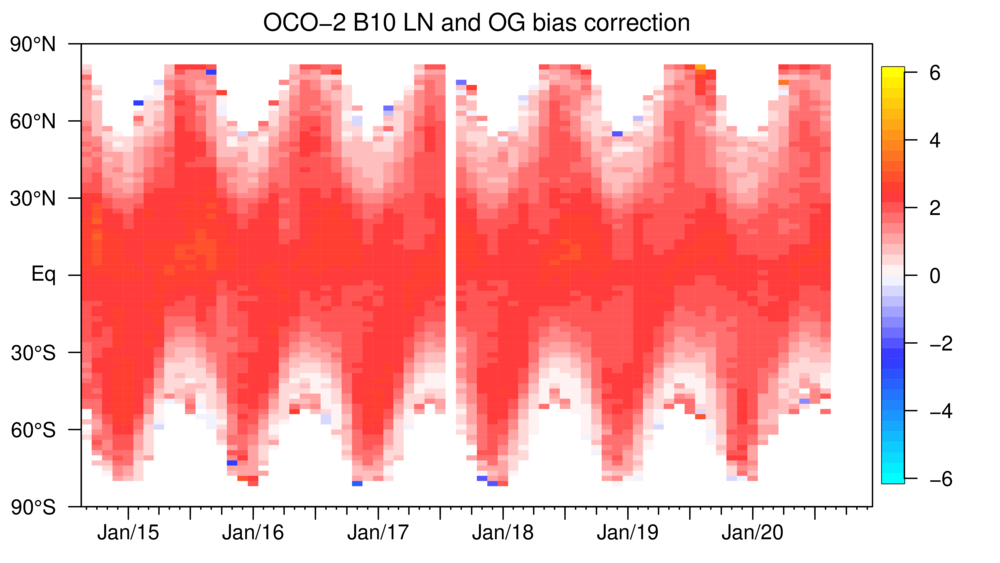
Fig 11. Zonal-mean LN and OG bias correction
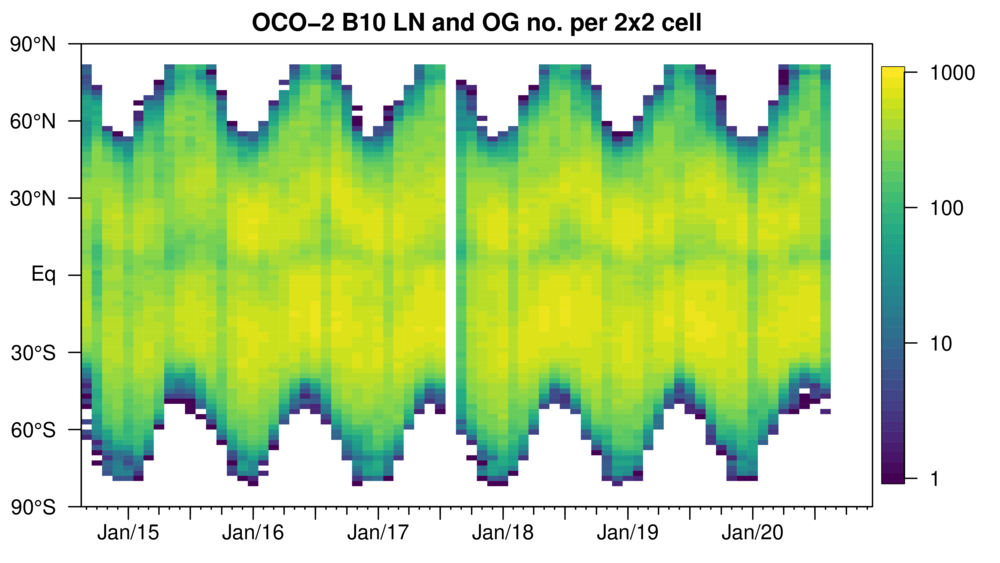
Fig 12. Zonal-mean number of LN and OG retrievals per 2°x2° cell
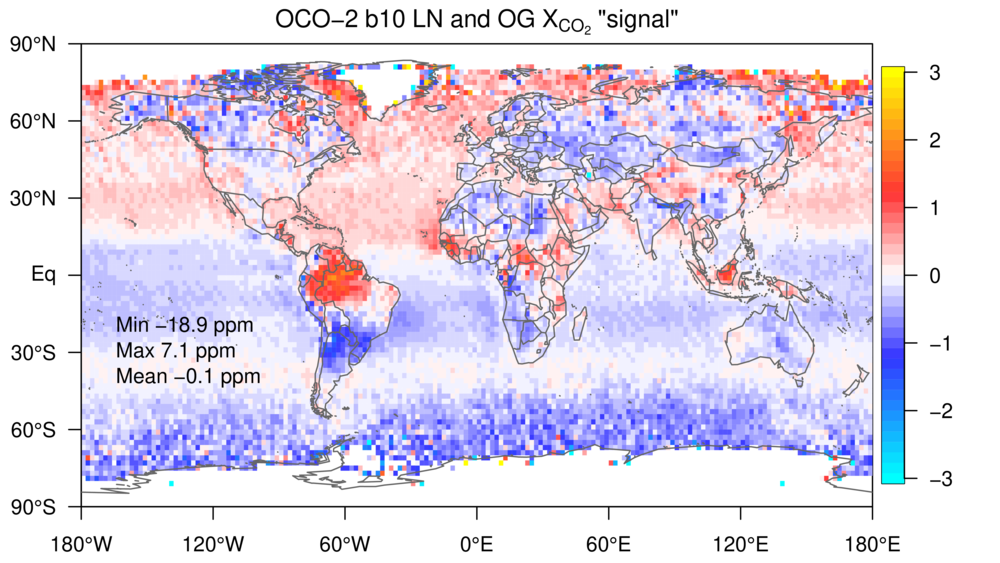
Fig 13. Time-mean LN and OG signal map
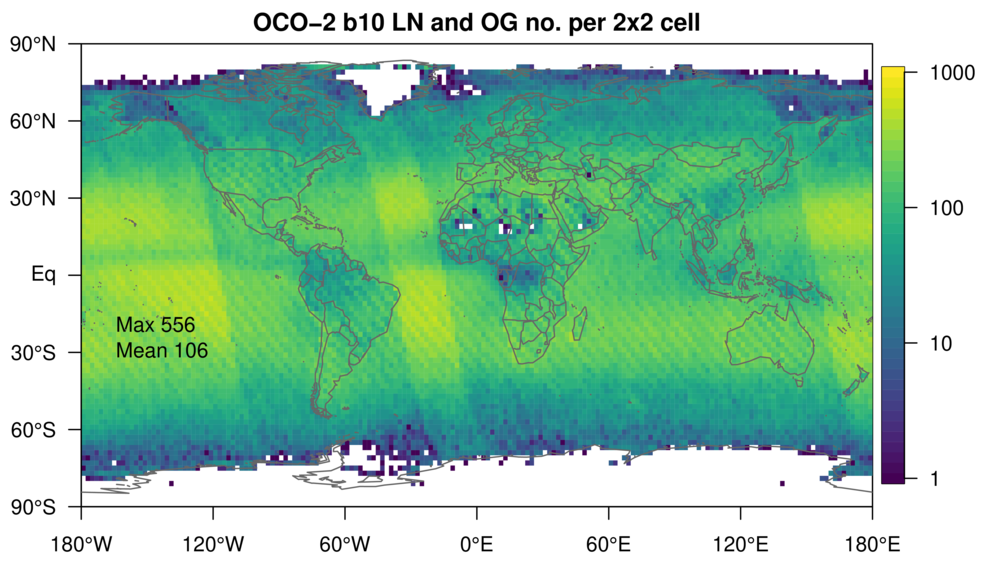
Fig 14. Time-mean number of LN and OG retrievals per 2°x2° cell
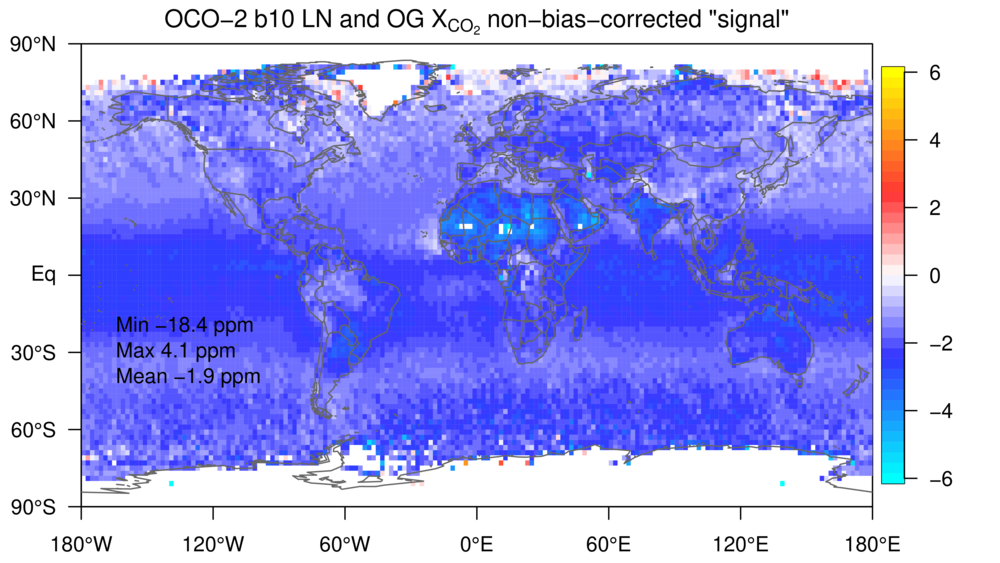
Fig 15. Time-mean LN and OG un-bias-corrected signal map
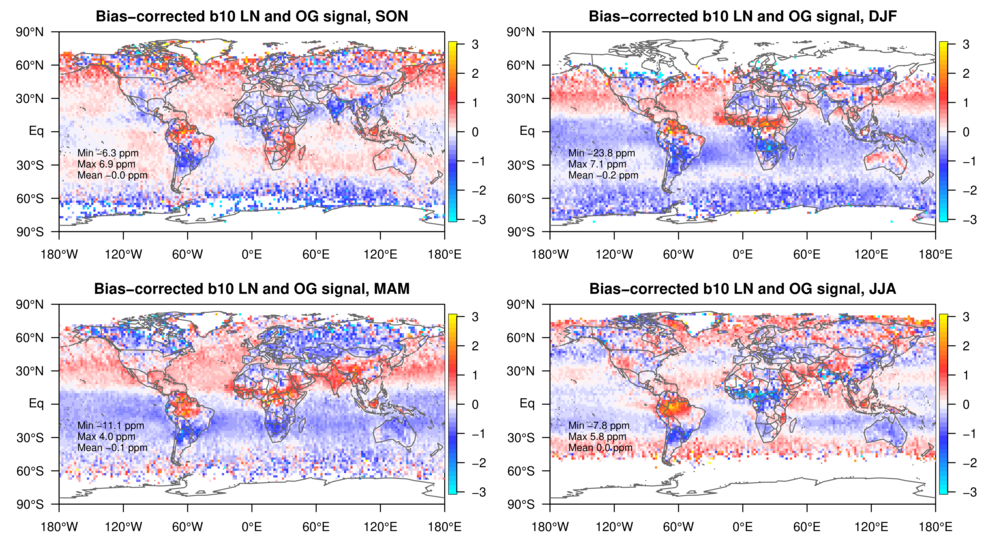
Fig 16. Seasonal LN and OG signal maps
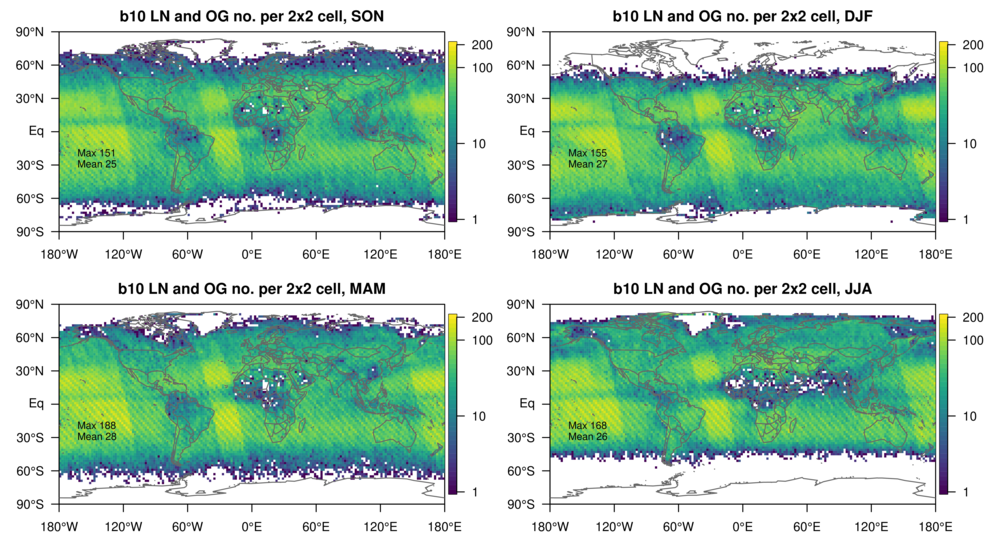
Fig 17. Seasonal number of LN and OG retrievals per 2°x2° cell, maps
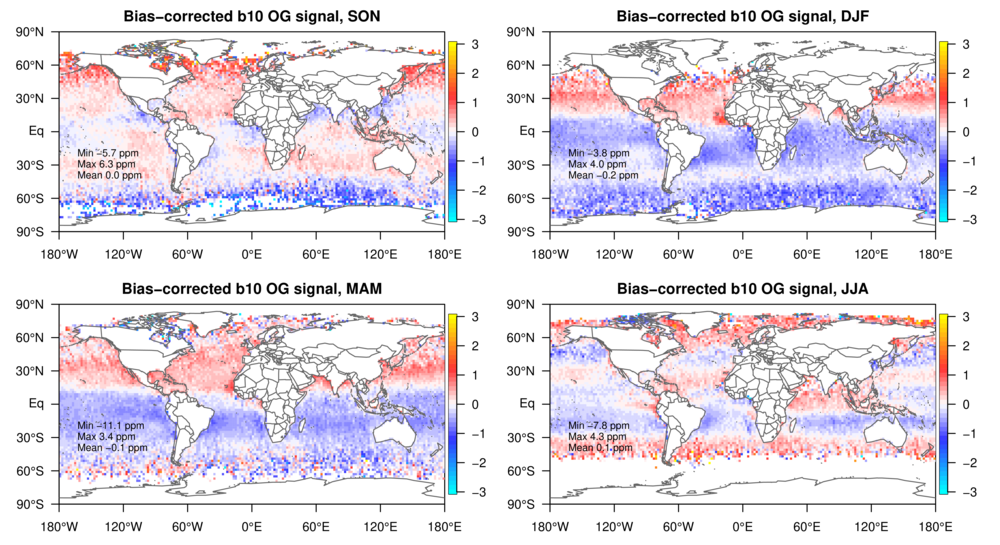
Fig 18. Seasonal OG signal maps
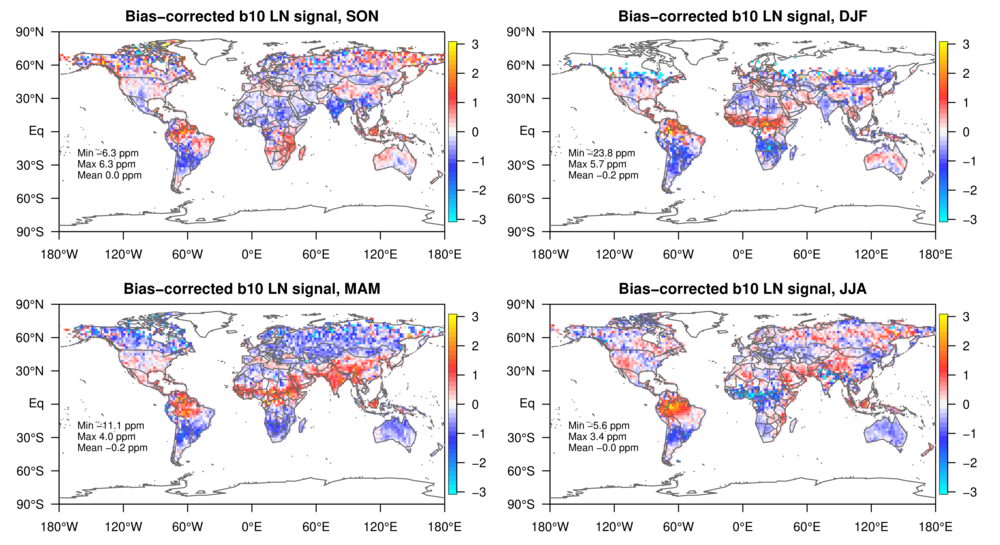
Fig 19. Seasonal LN signal maps
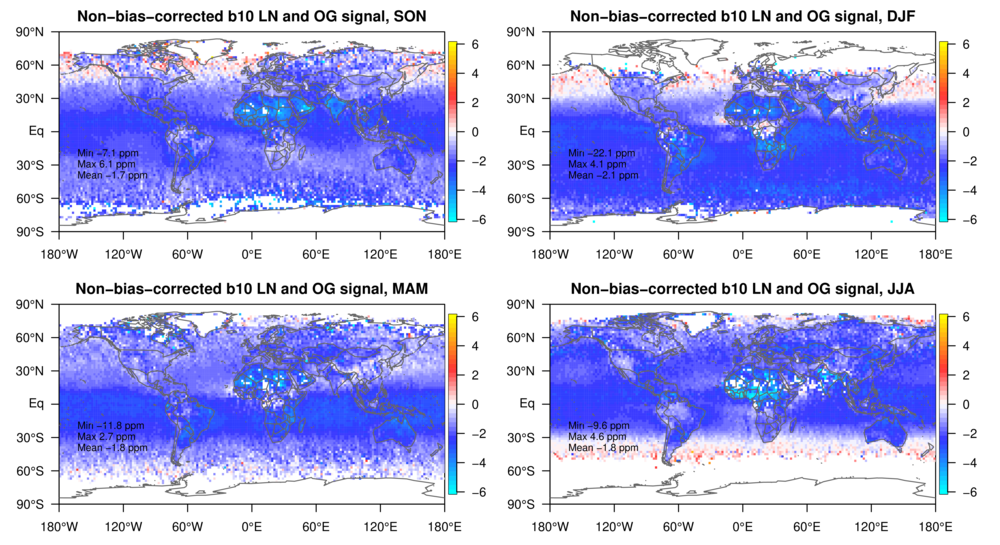
Fig 20. Seasonal LN and OG un-bias-corrected signal maps
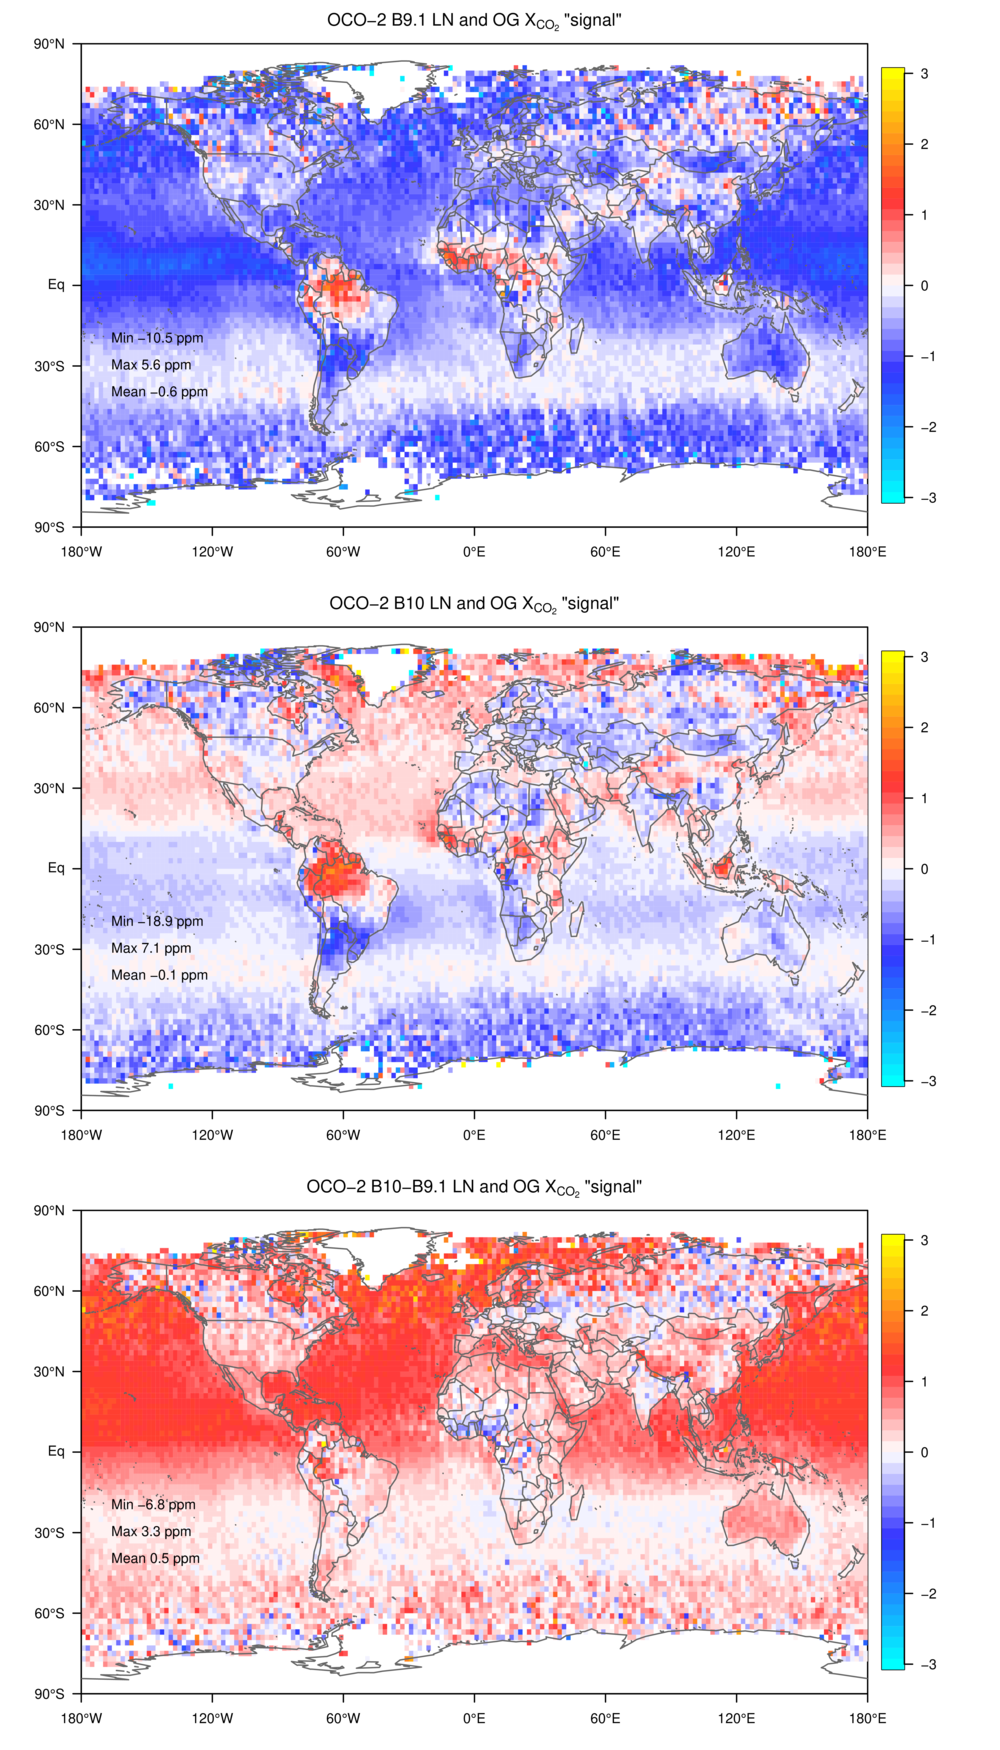
Fig 21. Time-mean changes from B9.1 to B10 LN and OG signal, maps
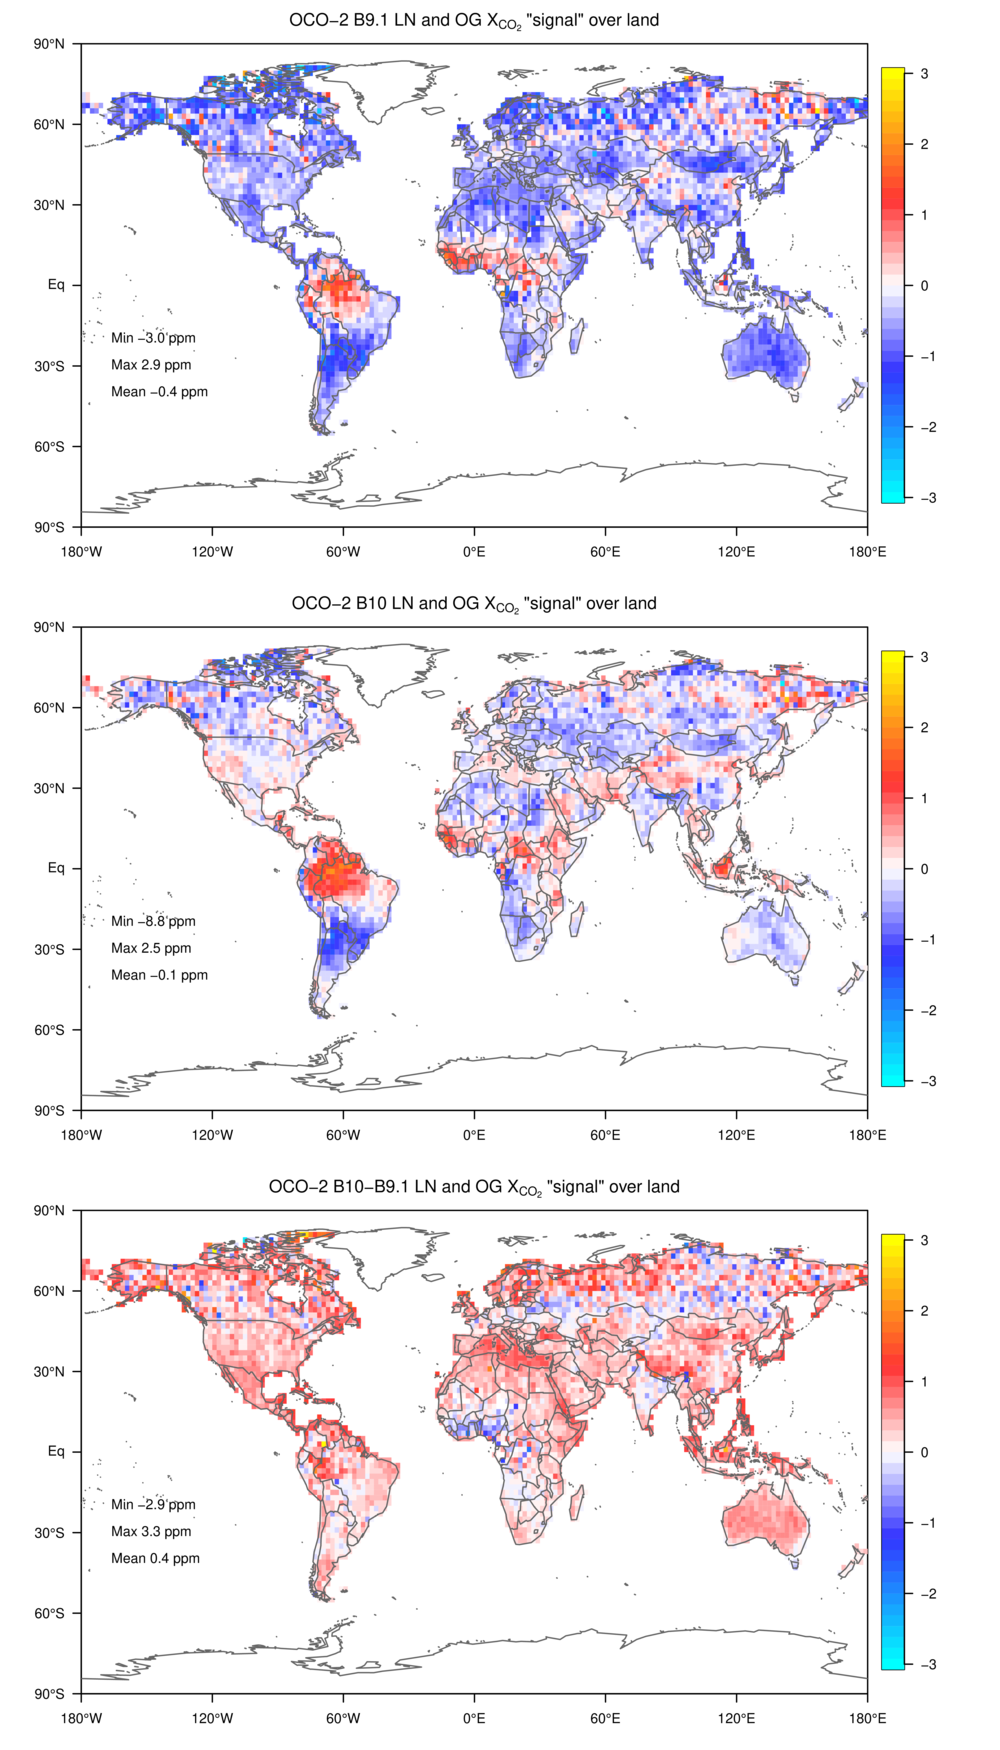
Fig 22. Time-mean changes from B9.1 to B10 LN signal, maps
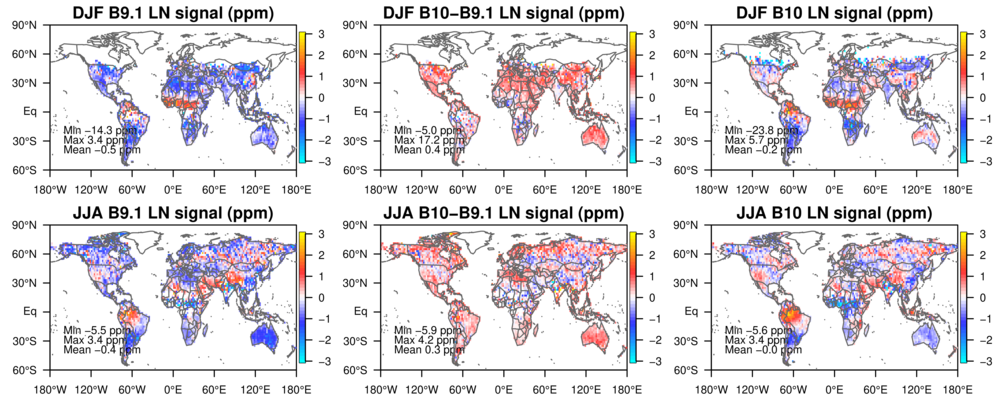
Fig 24. Seasonal changes from B9.1 to B10 LN signal, six-panel maps
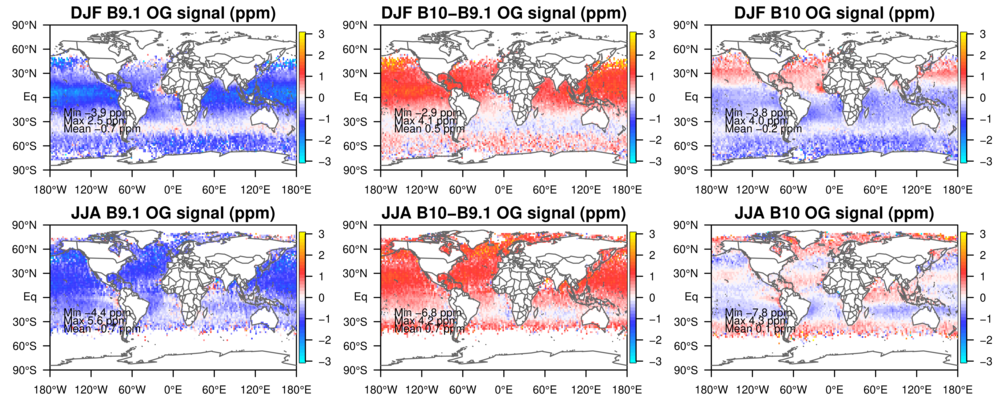
Fig 25. Seasonal changes from B9.1 to B10 OG signal, six-panel maps