WMO/IAEA Round Robin Comparison Experiment - Archived Results

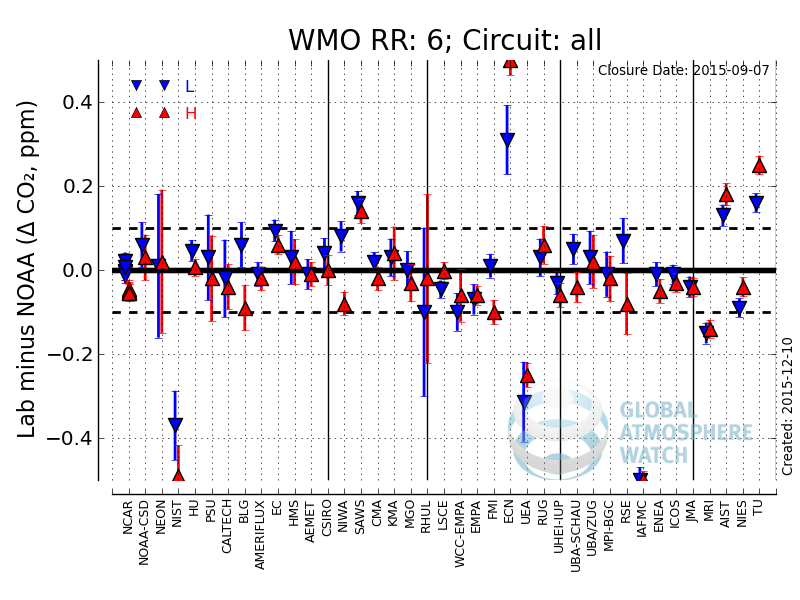
Figure Caption: The plot shows differences (lab minus Reference Laboratory) for each RR cylinder measured. The legend includes CO2 range specification (e.g., Low, Medium, High), and the cylinder serial number and approximate Reference Laboratory value (not shown on "Circuit: all" plots). The dashed lines around the zero line identify the WMO recommended level of network compatibility. If a difference exceeds the Y-axis plotting range, the difference is placed at the upper or lower end of the range. The plotted uncertainties are the lab and Reference Laboratory reported uncertainties added in quadrature (when available). In all plots, the results are shown in circuit and measurement date order. The vertical lines shown on the "Circuit: all" plot identify a circuit change (e.g., circuit 1 to 2). The date shown with the lab abbreviation on the x-label is the maximum measurement date reported by the lab (date not shown on "Circuit: all" plots). Participant lab information including lab abbreviation and assigned ID number may be found here. Data used to prepare this figure are presented below in tabular form.

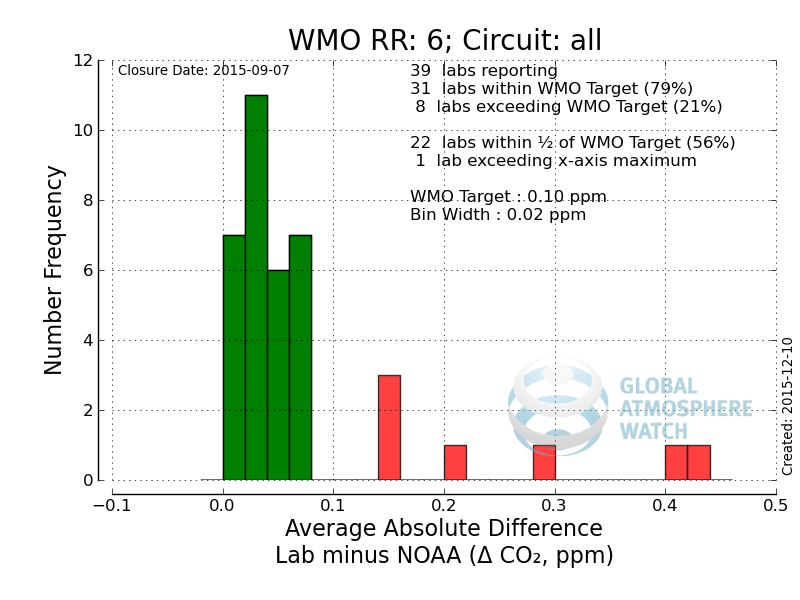
Figure Caption: The histogram shows the number of labs (for all circuits) whose computed average of absolute differences (lab minus Reference Laboratory) falls within each bin. Data used to prepare this figure are presented below in tabular form.
