
Barrow's Annual Snow Cycle; Ecological Responses to a Lengthening Snow-free Season
NOAA Earth System Research Laboratory, R/GMD, 325 Broadway, Boulder, CO 80305-3328
Robert.Stone, Science and Technology Corporation, Boulder, CO
Updated April 2017
ACKNOWLEDGEMENTS: This study was initially supported by NOAA's Earth System Research Laboratory's (ESRL) Global Monitoring Division (GMD), the International Arctic Research Center (IARC) and the Cooperative Institute for Alaska Research (CIFAR) - University of Alaska. Original content can be found at: Barrow Snowmelt Date. This update includes ancillary analyses provided by D. Douglas (USGS) - sea ice conditions and regional phenology; C. Sweeney - methane response to the annual snow cycle; and G. Dutton - the response of chloroform to the annual snow cycle. The paper of Cox et al. (2017) provides the basis for the following presentation and many of the figures.
Background
To understand global climate change more fully it is necessary to assess the variability of earth's cryosphere in response to other climatic factors. In particular, the timing of the disappearance of snow each year can influence the net energy budget for an entire season. Feedbacks involving the change in surface albedo may enhance or diminish any response, which may be manifested in the regional temperature regime. At the NOAA Global Monitoring Laboratory (GML) Barrow Observatory (BRW) the date of snowmelt has been observed since the mid 1980s, with the National Weather Service providing data since 1921 and a few observations from cooperative programs dating back to 1902. Since 1986, NOAA has made a determination of spring snow disappearance, referred to as snowmelt date, on the basis of objective, radiometric measurements made over open tundra at BRW. The melt is determined when the measured daily mean surface albedo drops below 0.3. The methodology is described in Stone et al. (2002).
Drivers and Environmental Responses to the Changing Annual Snow Cycle of Northern Alaska
The following figures and discussion are based on Cox et al. (2017), which updates the earlier record of snowmelt at BRW (Barrow Snowmelt Date) and greatly expands the scope of the earlier studies of Stone et al. (2002; 2005). In addition to determining snowmelt date, snow-in date at BRW is determined from snow depth observational records, and since 1986 using radiometric data. The snow-in date is defined as the day when > 1 inch (2.54 cm) of snow persists or when albedo exceeds 60% and is sustained at greater values in autumn. In addition, several key environmental responses to the length of the snow-free season are investigated, including impacts to the surface radiation budget, permafrost temperatures and biogeochemical cycles involving vegetation and fluxes of greenhouse gases.
Figure 1a shows a climatology of albedo at BRW from late winter through the autumn transition, with a few anomalously early years of snowmelt highlighted as indicated in the legends. Thresholds for melt and snow-in determinations are indicated at the 0.3 and 0.6 levels, respectively. For selected years, similar time series from the Department of Energy ARM North Slope of Alaska (NSA) site near BRW, and a recently established facility at Oliktok Point about 265 km east of BRW (see: https://www.arm.gov/capabilities/observatories/nsa) are shown for comparison. At all locations near the northern Coast of Alaska, snow melts very rapidly each spring making radiometric monitoring of the event reliable and useful for evaluating changes related to the warming climate of the region. The years 2002, 2015 and 2016 are highlighted as being anomalously early years of melt, with 2016 establishing a new record at BRW. Factors that determine the timing of snowmelt in this region are discussed in following sections.
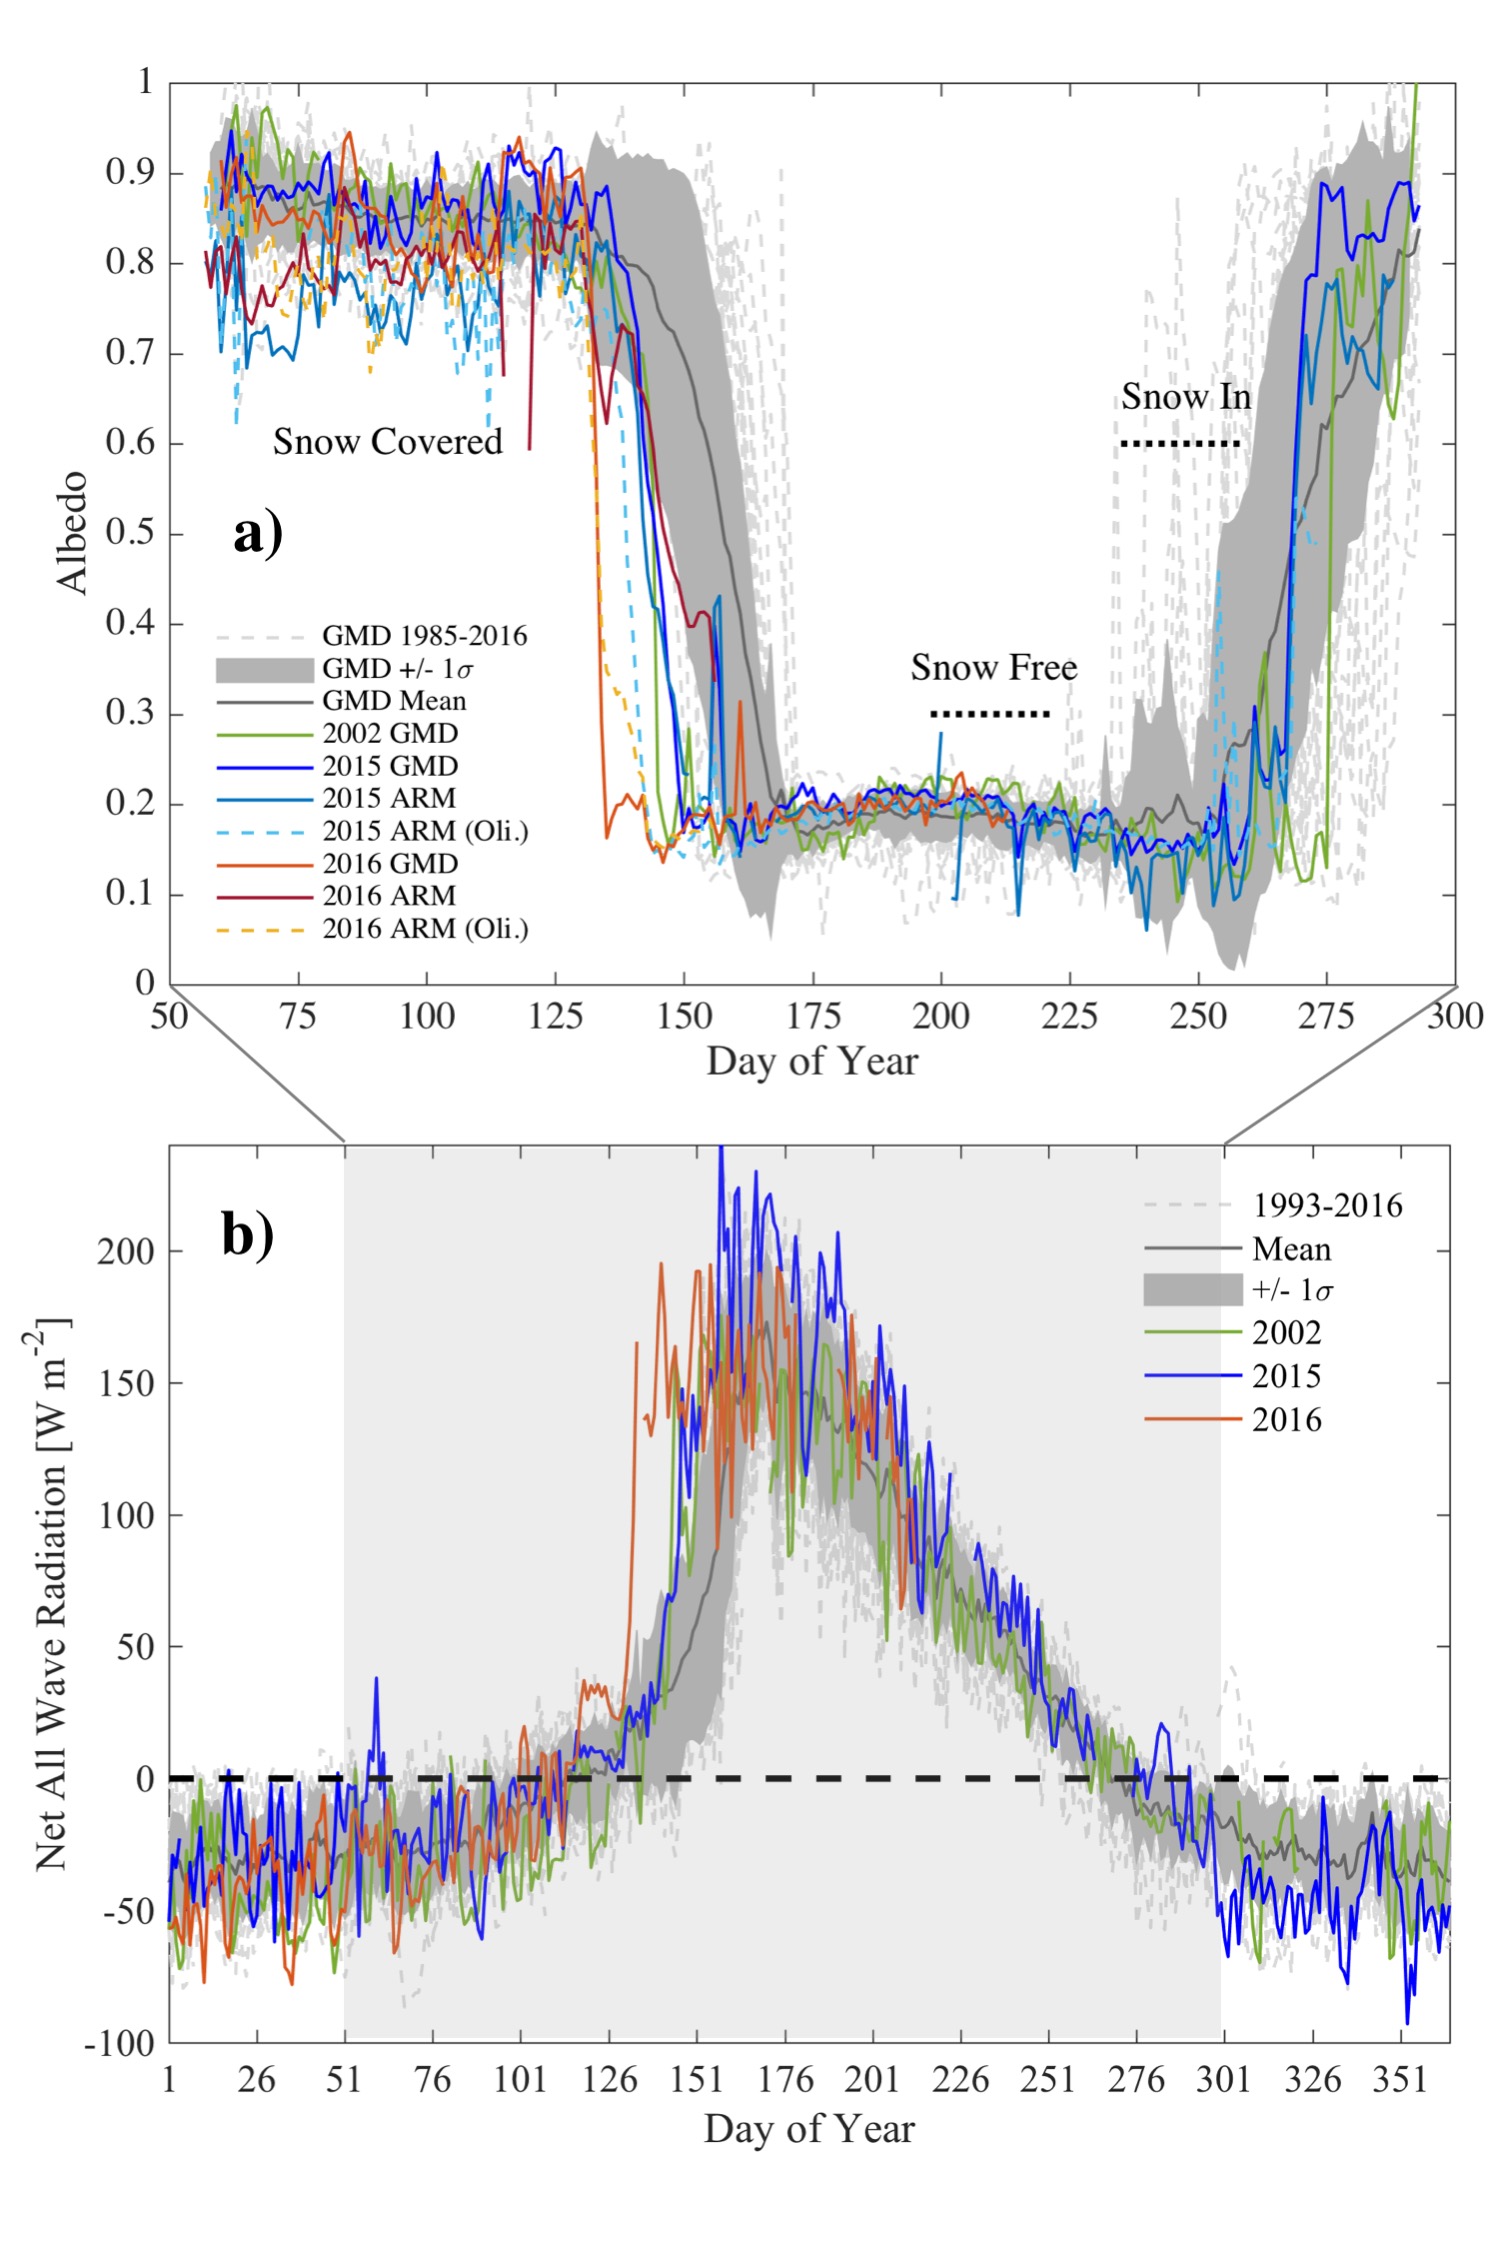
Figure 1b shows the net surface radiation budget (SRB) climatology, 1993-2016, derived from measurements made at BRW, again highlighting the anomalously early years of 2002, 2015 and 2016. There is a dramatic increase in net radiation each spring coincident with the timing of snowmelt due to the absorption of solar radiation by the darker tundra. This feature is especially pronounced in 2016, but is later dampened due to a cooler summer with greater than average cloud cover (Cox et al., 2017).
Historical Snowmelt Time Series: Corroborative Records
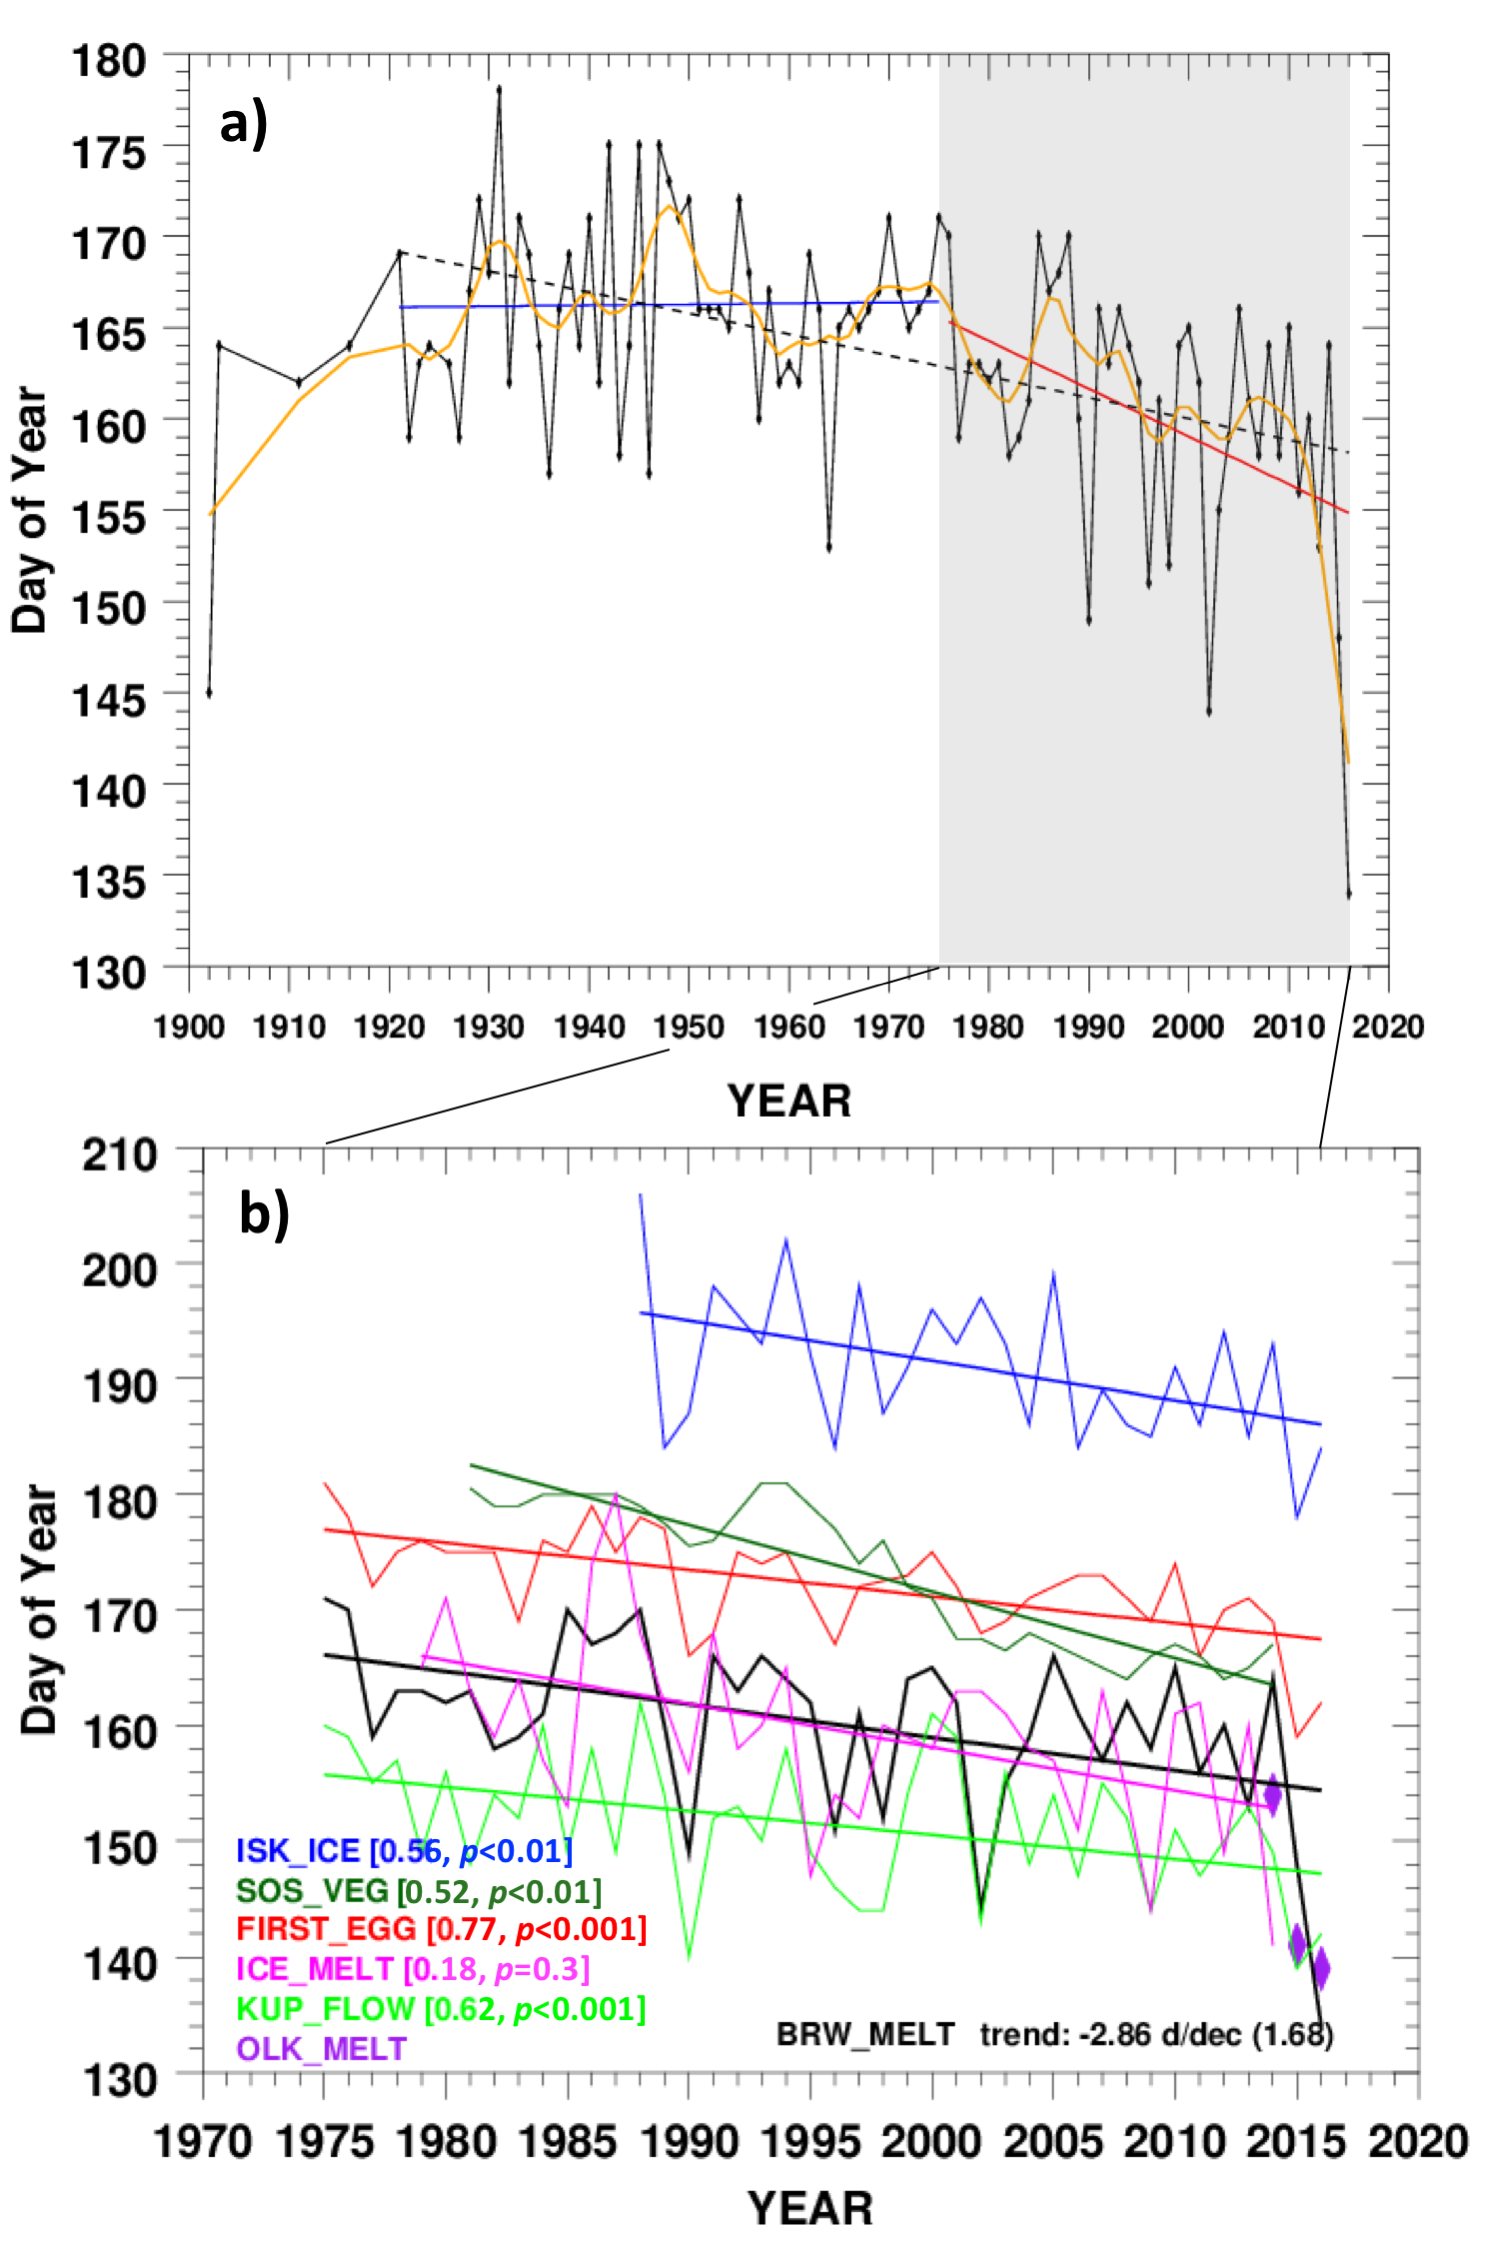
Figure 2a is a time series of snowmelt date for Barrow that dates from 1902, constructed from a combination of snow depth observations, proxy temperature records, and since 1986, radiometric data used to derive surface albedo. The methodology for merging the data is described in Stone et al. (2002). Close examination of the long time series reveals a statistically significant trend towards earlier snowmelt after the mid-1970s (-2.68 days/decade at the 95% confidence level). This occurs during a period of significant warming across Alaska (Wendler et al., 2014). A deepening of the Aleutian Low after 1975 was found to promote enhanced southerly flow over Alaska, which has been shown to contribute to earlier snowmelt at BRW (Stone et al., 2005). The mechanism for the advection of warm air into the Arctic and time series of monthly mean surface air temperatures at BRW are discussed in more detail at https://gml.noaa.gov/grad/westernarctic.html. Note that the very early melt dates for 2015 and 2016, being end points, exacerbate the trend and are the focus of ongoing study as to whether these are true anomalies or signal a shift towards generally earlier snowmelt at BRW related to Arctic amplification (Cox et al., 2017; references therein).
Figure 2b is an ensemble of time series of other metrics linked to the timing of snow disappearance in the vicinity of BRW. SOS_VEG represents the beginning of greening of the tundra vegetation derived from the Normalized Difference Vegetation Index (NDVI) measured by polar-orbiting satellites. Each is correlated with BRW melt dates as described in the figure-caption and legends. With exception of the onset of sea ice melt north of BRW (ICE_MELT), statistically significant correlations indicate inter-related environmental responses to the timing of snowmelt and provide a regional context in terms of the changing climate of the North Slope of Alaska. For instance, drainage of the Kuparuk River basin, as measured by its discharge rate, correlates with snowmelt at BRW, indicative of a wide-scale hydrological response. Not surprising, greening of the tundra commences shortly after the snow melts. Fig. 2b further corroborates the regional representativeness of BRW illustrated by Barrow Snowmelt Date; Fig. 3.
Length of Snow-free Season: Sea Ice Decline and Temperature Response
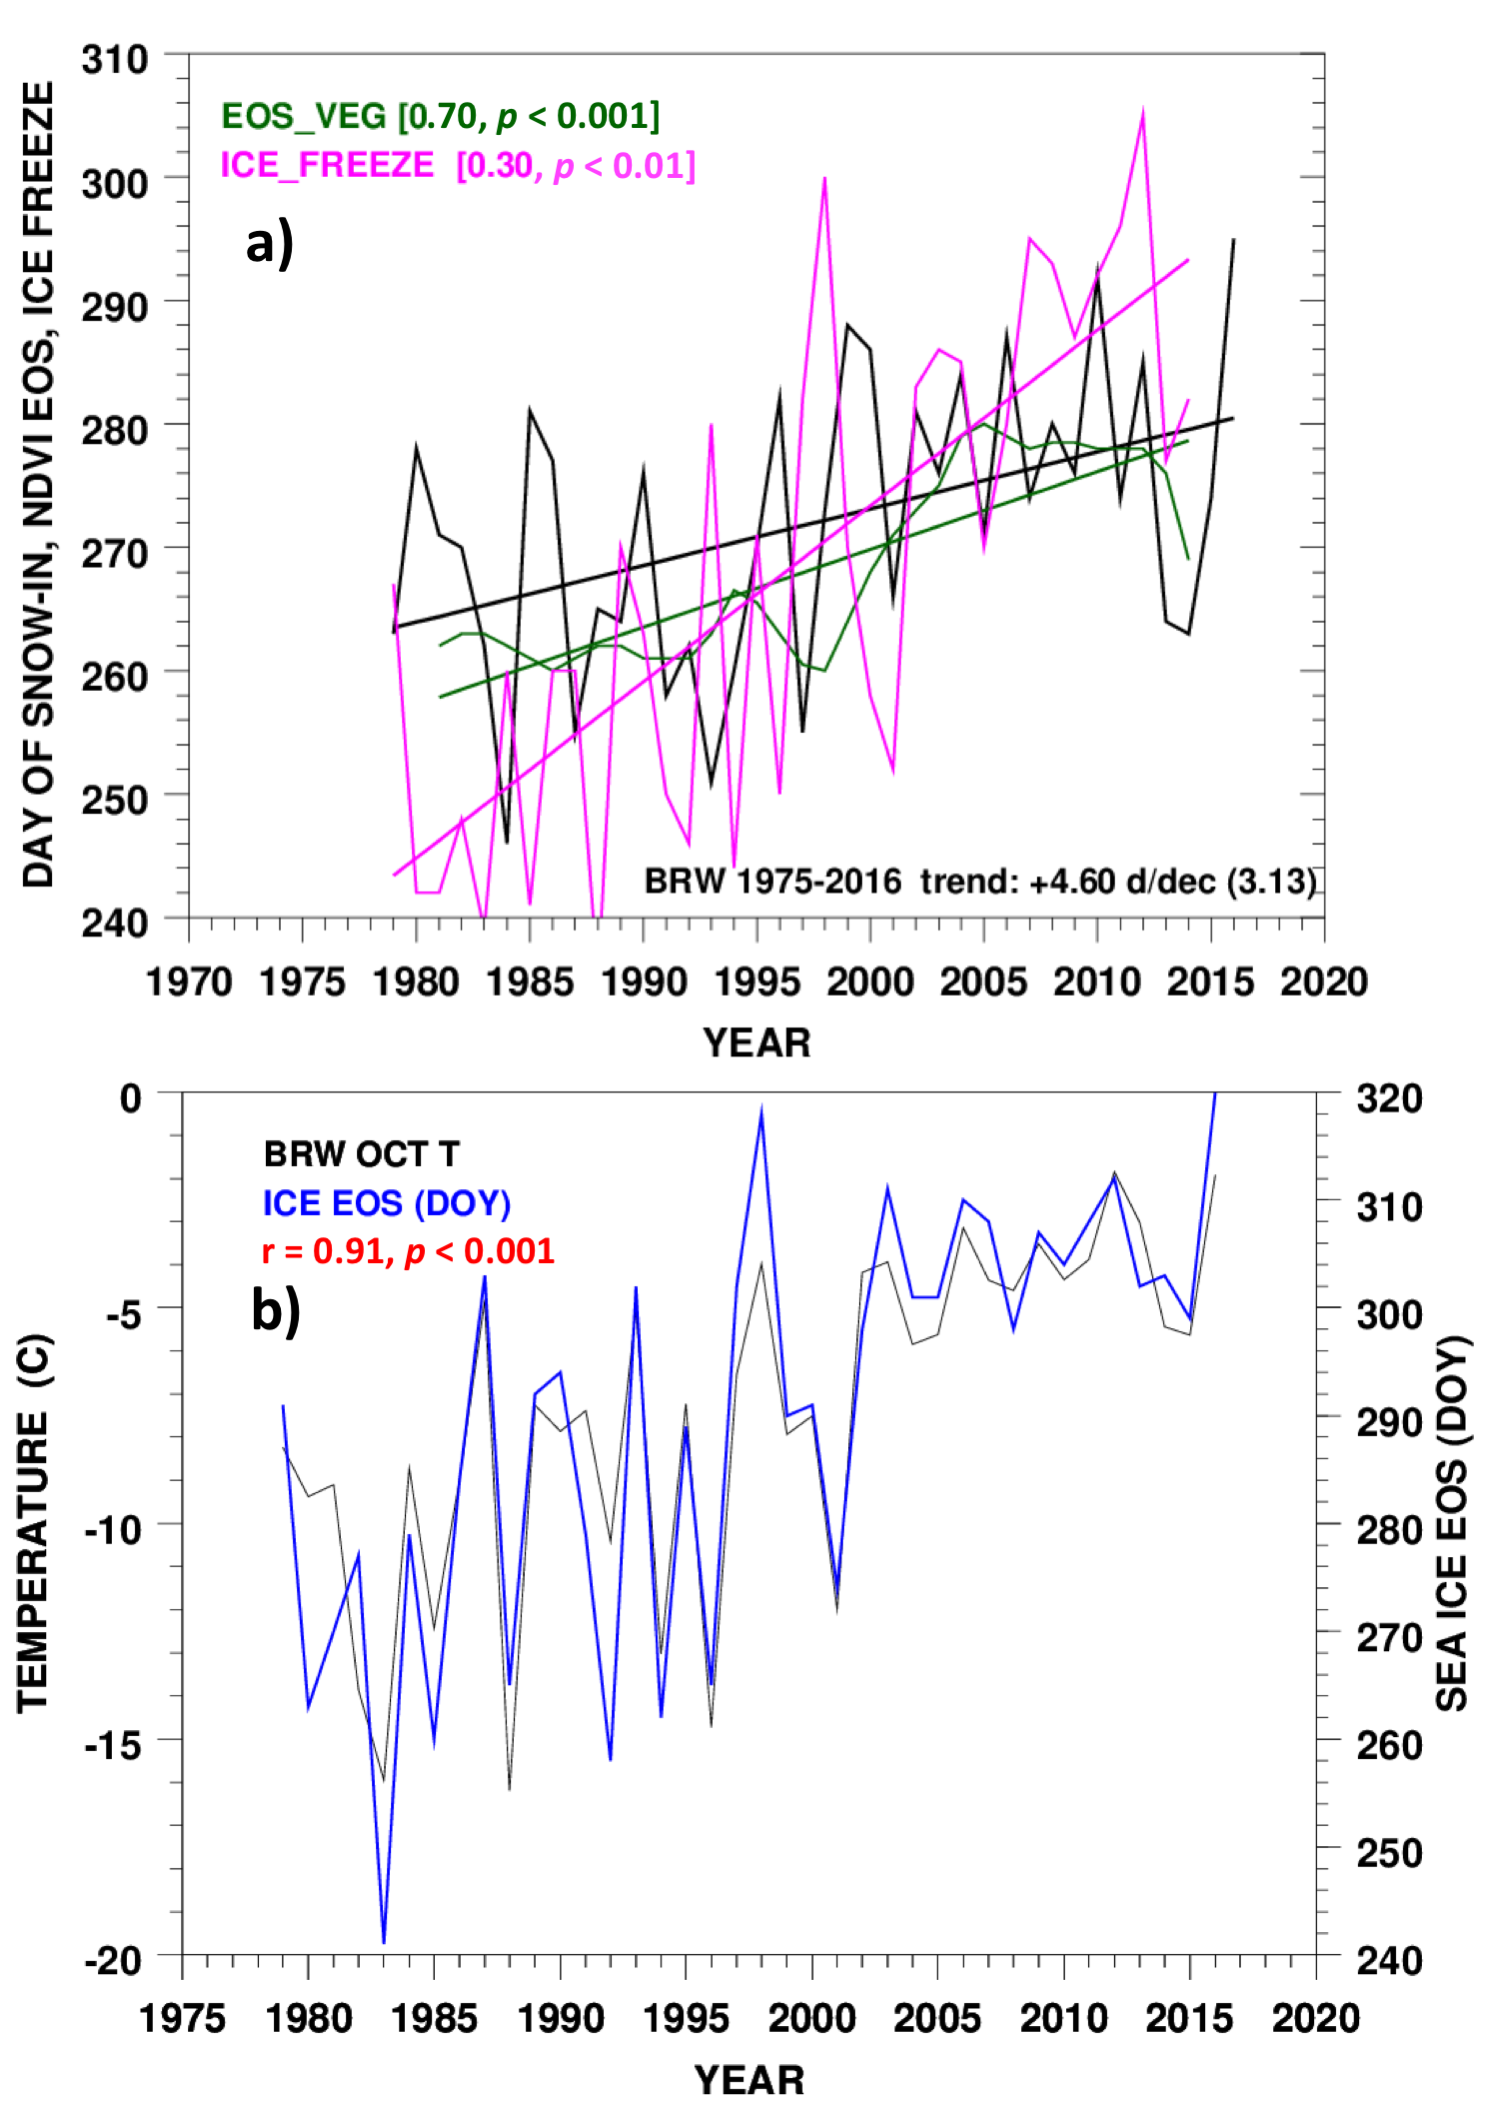
Figure 3a shows a time series similar to Figure 2b, but for the end of season (EOS), when snow begins to accumulate at BRW, determined from snow depth measurements before 1986 and an albedo > 0.6 since. The correlation between the end of the growing season (EOS_VEG) and establishment of the snowpack is significant, noting that the BRW snow-in time series was first smoothed using a three-year moving average to match the resolution of the NDVI product (Didan and Barreto, 2016). Although the onset of ice freeze is not as highly correlated, it shows the greatest upward trend since the late 1970s, consistent with significant loss of sea ice in the western Arctic region (e.g., Stone et al., 2005). This trend of an ensemble of diverse but correlated metrics is compelling evidence that the summer to autumn transition is occurring later than in the past, with a pronounced shift around 2000, especially in the timing of sea ice formation in the region north and east of BRW. Combined with an earlier start of season (SOS) (Fig. 2b), the overall length of the snow-free season at BRW has increased dramatically since the late 1970s. During the period, 1979-2016, the average length of season was 112 days, during which it has increased by 7.4 days per decade (± 4 at a confidence level of 95%).
One impact of a longer snow- and ice-free season in the vicinity of BRW is that autumn temperatures have risen dramatically in response. Figure 3b shows the very strong correlation of near-surface air temperature in October with the day of year when sea ice in a region north and east of BRW covers > 60%. The temperature at BRW in autumn is primarily influenced by a prevailing wind from the ENE, having a fetch over the Beaufort Sea (see https://gml.noaa.gov/grad/westernarctic.html). The extent and concentration of sea ice in the Beaufort Sea moderates the air circulating above and therefore impacts inland coastal areas downwind. Because sea ice in the Chukchi and Beaufort Seas has declined, especially in the post-2000 period, there has been a delay in ice formation via a feedback involving sea water absorbing solar radiation during late summer, which in turn warms adjacent lands in autumn (Wendler et al., 2014; Cox et al., 2017).
Factors that Influence the Timing of Snowmelt at BRW
Stone et al. (2002) hypothesized that the timing of the spring melt varied with the amount of snow accumulated over winter, and temperature and cloud amount during the spring transition that pre-condition the snowpack even before the onset of melt later in May. Figure 4 updates the earlier analysis and includes a new metric, E-W 850mb, that relates to atmospheric circulation that modulates the advection of air from the north Pacific Ocean into the Arctic. Fig. 4a is again the time series of snowmelt dates at BRW, 1975-2016, linearly fitted (red line) to show the trend and smoothed (blue line) to reveal any decadal variations. As described in the figure-caption, subsequent plots are time series of factors being evaluated to assess their influence on the timing of snowmelt at BRW. Each has been cross-correlated and its statistical significance noted in the respective legends. The greater the correlation coefficient (r) and lower the p-value, the higher probability that a given factor has an impact on the date of snowmelt. Contrary to the early findings of Stone et al. (2002), the accumulation of snow during winter is not a primary factor. In fact, snowfall (measured in water equivalent units) in 2014/2015 and 2015/2016 was at or above normal, while melt dates were the third and record earliest of the 115-year record, respectively (Fig. 2a). On the basis of correlation, Mar/Apr and May mean temperatures are found to have the greatest influence on date of snowmelt, indicative of conditioning the snowpack prior to the onset of melt as well as a more direct effect during the final days of melt.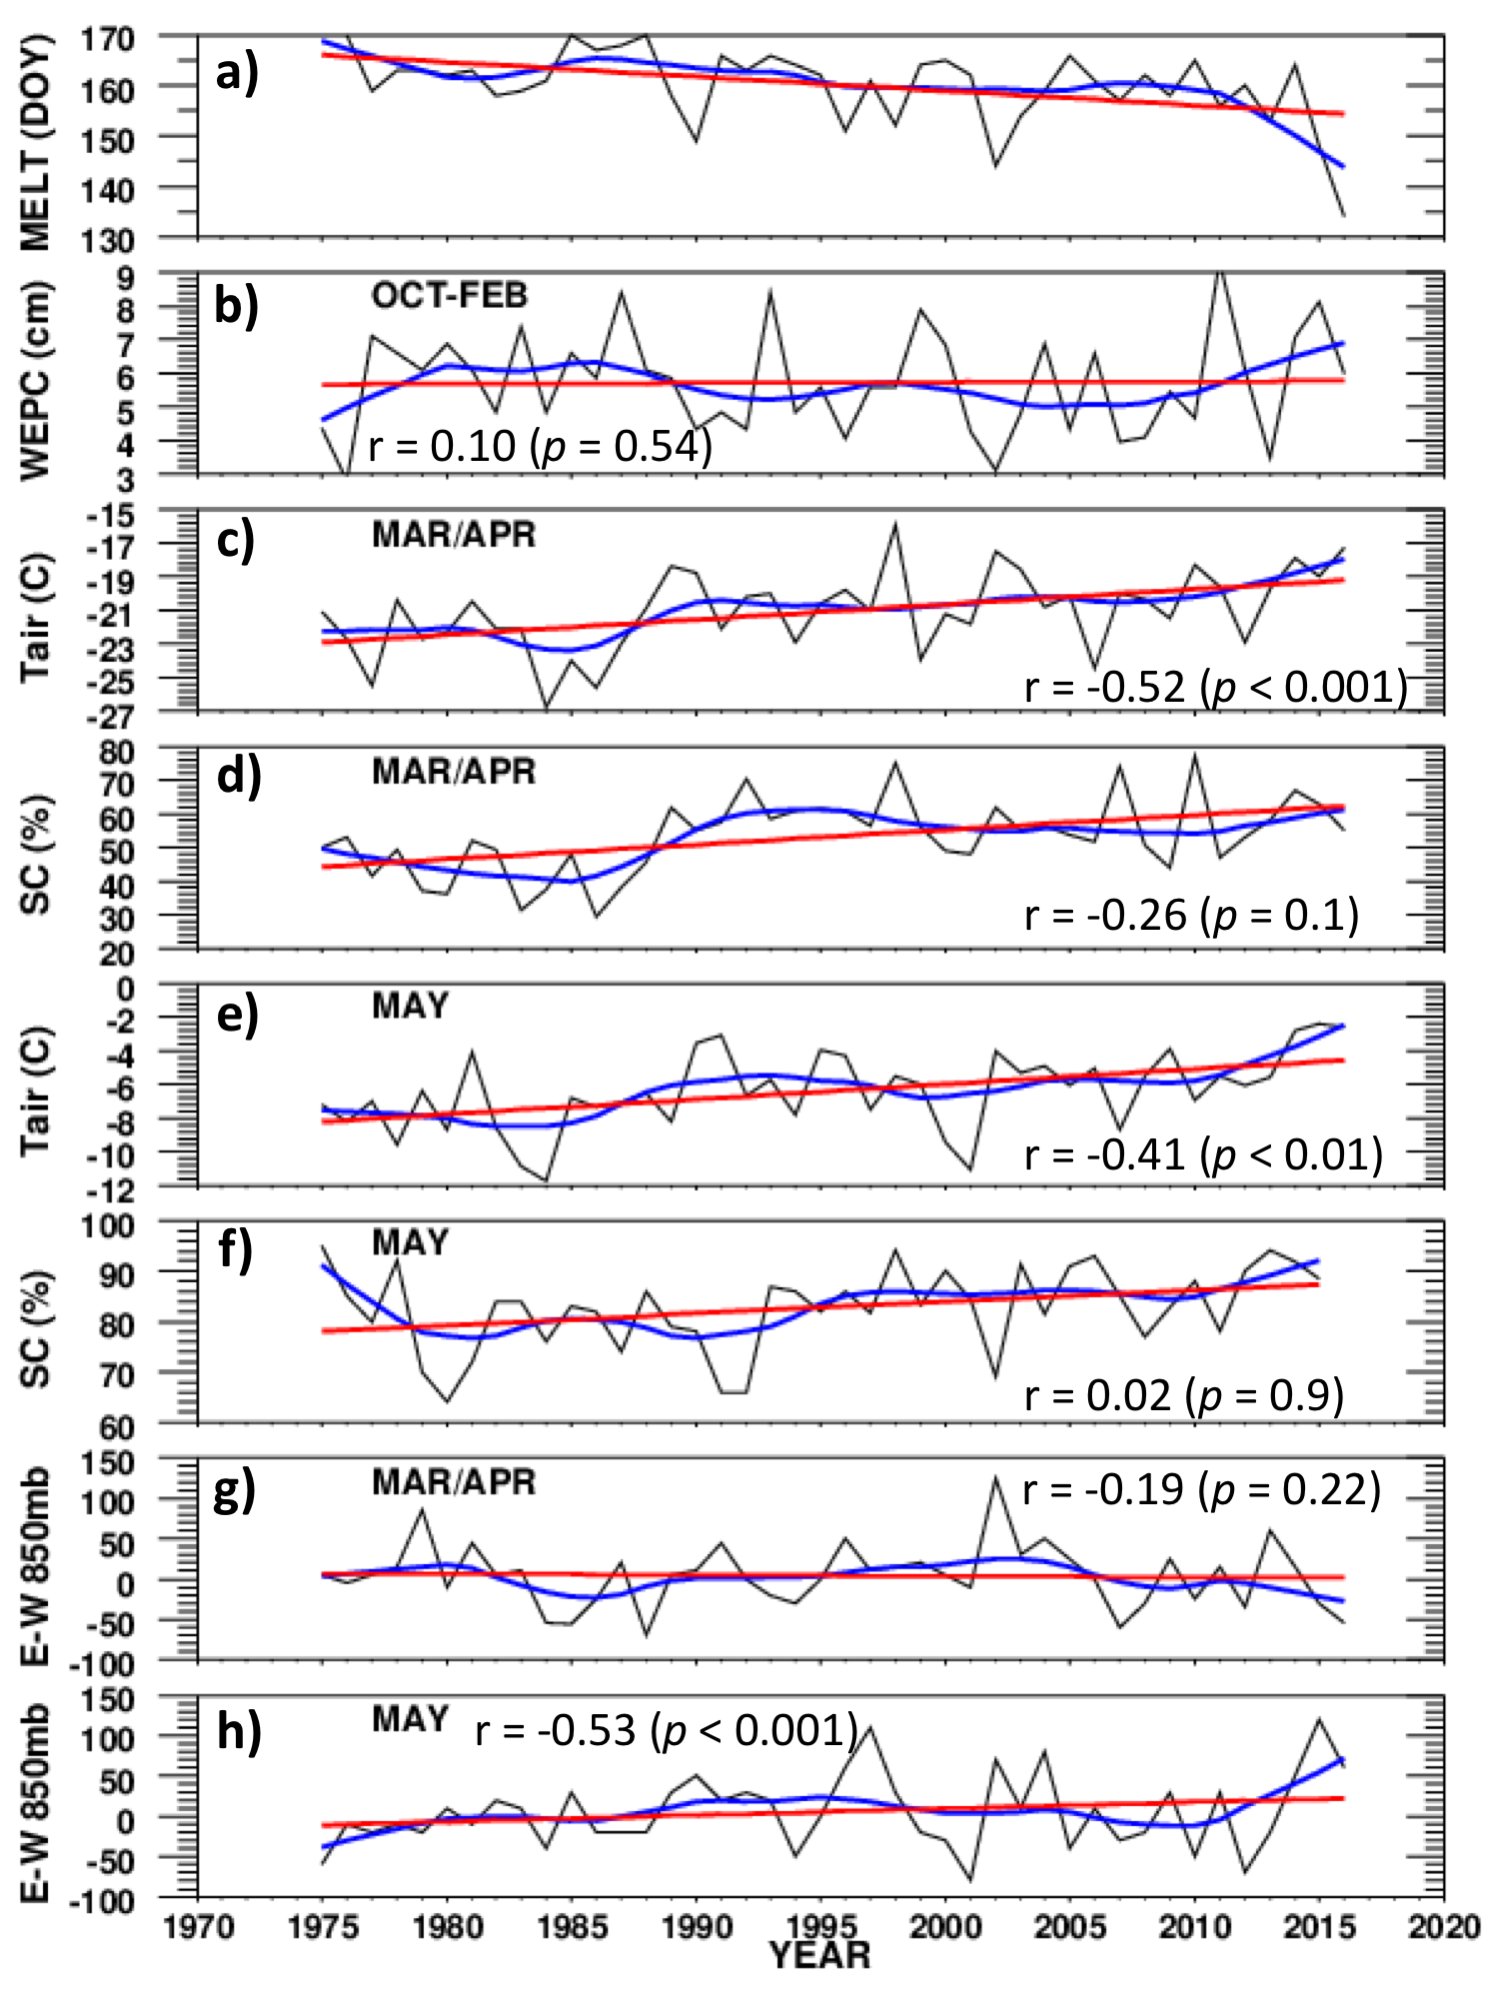
Figures 4g and 4h introduce a metric that relates to synoptic-scale circulation patterns during Mar/Apr and May, respectively. The E-W index quantifies the difference in geopotential height at the 850 mb pressure level of two selected points located along 55°N latitude. The western point falls generally within the Aleutian Low and the eastern point is sometimes under a high pressure ridge. The strength of the E minus W pressure gradient determines flow of warm moist air over Alaska. The concept was illustrated in Stone et al. (2005) and the index introduced by Cox et al. (2017); also see https://gml.noaa.gov/grad/westernarctic.html for more details and examples. Essentially, the E-W index quantifies the strength of a dipole established when the Aleutian Low shifts westward and a high pressure ridge forms over the eastern Pacific, with its axis extending into Alaska. Positive values of E-W favor the northward advection of Pacific air across Alaska and beyond, influencing conditions in the Chukchi and Beaufort Seas. Not only is this air relatively warm but moist, which promotes increased cloudiness and thus can enhance warming through thermal emission (e.g., Stone, 1997). Note in Fig. 4h that during May of 2015 and 2016, E-W was anomalously positive and this produced heat waves (Fig. 4e) and greater cloud cover (Fig. 4f) at BRW. Thus, while temperature is a primary factor in determining the timing of snowmelt, changing atmospheric dynamics must be considered as an underlying mechanism that produces variations. How circulation patterns have evolved and are impacting the climate of the Alaskan Arctic over time is a focus of ongoing research.
Environmental Responses to a Lengthening Snow-free Season
The earlier snowmelt and longer growing season trends observed at BRW (Figures 2b and 3a) represent changes that are taking place throughout eastern Russia and Alaska (Cox et al., 2017). Associated with the changing annual snow cycle are environmental responses. These include greening of the tundra, warming of soil and the potential for enhanced emissions of greenhouse gases due to thawing permafrost. The onset of the Arctic growing season is primarily constrained by temperature and therefore closely linked to the timing of snowmelt. The end of the growing season is more complicated, however, because it occurs when solar radiation is decreasing rapidly and thus temperature is controlled more by advection of air and cloud radiative forcing as well as when snow begins to accumulate.
Changes in vegetation phenology (with special thanks to K. Didan)
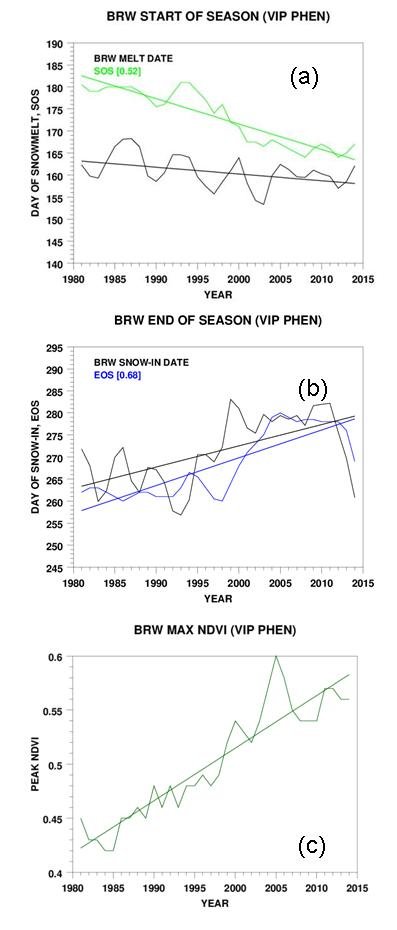
As discussed above, earlier melt and later freeze, accompanied by losses in summer sea ice and delayed sea ice formation in autumn, have all contributed to lengthening the snow-free season in the vicinity of BRW. Figure 5a and Figure 5b compare the timing of snowmelt and snow-in at BRW with the start and end of the growing seasons, SOS and EOS, respectively. SOS and EOS metrics are derived from the normalized difference vegetation index (NDVI) calculated using the method of Didan and Barreto (2016); see also Cox et al. (2017). The area evaluated covers about 500 square kilometers south of BRW. The BRW time series are smoothed to match the 3-year moving average of the NDVI data; cross-correlations are given in parentheses. In large part, due to the earlier snowmelt and SOS, peak values of NDVI have also increased by about 35% since the early 1980s as indicated in Figure 5c, consistent with general greening of the Arctic.
Response of permafrost
NOAA has been monitoring soil temperature at BRW since late summer, 2011, using a custom-built probe with 10 thermistors placed at depths of 5, 10, 15, 20, 25, 30, 45, 75, 95 and 120 cm. Each minute, values are recorded and archived. From this high resolution data, responses to changing weather and longer term climate variations are readily determined. In particular, thaw processes, the depth of the permafrost active layer and onset and duration of the "zero curtain" - the period when the active layer maintains a temperature near 0°C due to the release of latent heat during phase change from liquid to solid - can be quantified. The spring thaw is closely linked with the timing of snowmelt at BRW. The depth of the active layer is influenced by melt date but also is modulated by summer weather depending on air temperatures and cloudiness. Refreezing of soil during the autumn/winter transition is much more complicated, depending not only on when snow begins to accumulate but on air temperature that in turn is affected by air flow patterns and cloud radiative effects. These factors combined determine the onset and duration of the zero curtain. Figure 6 and Figure 7 are time series for 2012-2016 that show the behavior of soil temperature during the spring and autumn transitions, respectively. The timing of snowmelt, snow-in and period of zero curtain are highlighted for each year, revealing the complexity and variability in the response of soil temperatures to atmospheric conditions. Note that during the anomalously early years, 2015 and 2016, of snowmelt at BRW (Fig. 2) soil temperatures tend to rise rapidly in response to the May heat waves that occurred (Fig. 4e). Following snowmelt, a diurnal temperature cycle in the uppermost layers of the soil is established. The maximum active layer depth (ALD) that occurs later in summer (not shown) was deeper, by about 6 cm, in both 2015 and 2016 than in 2013 and 2014. Average ALD is about 63 cm at BRW, occurring within a few days of 24 August on the basis of this short time series.
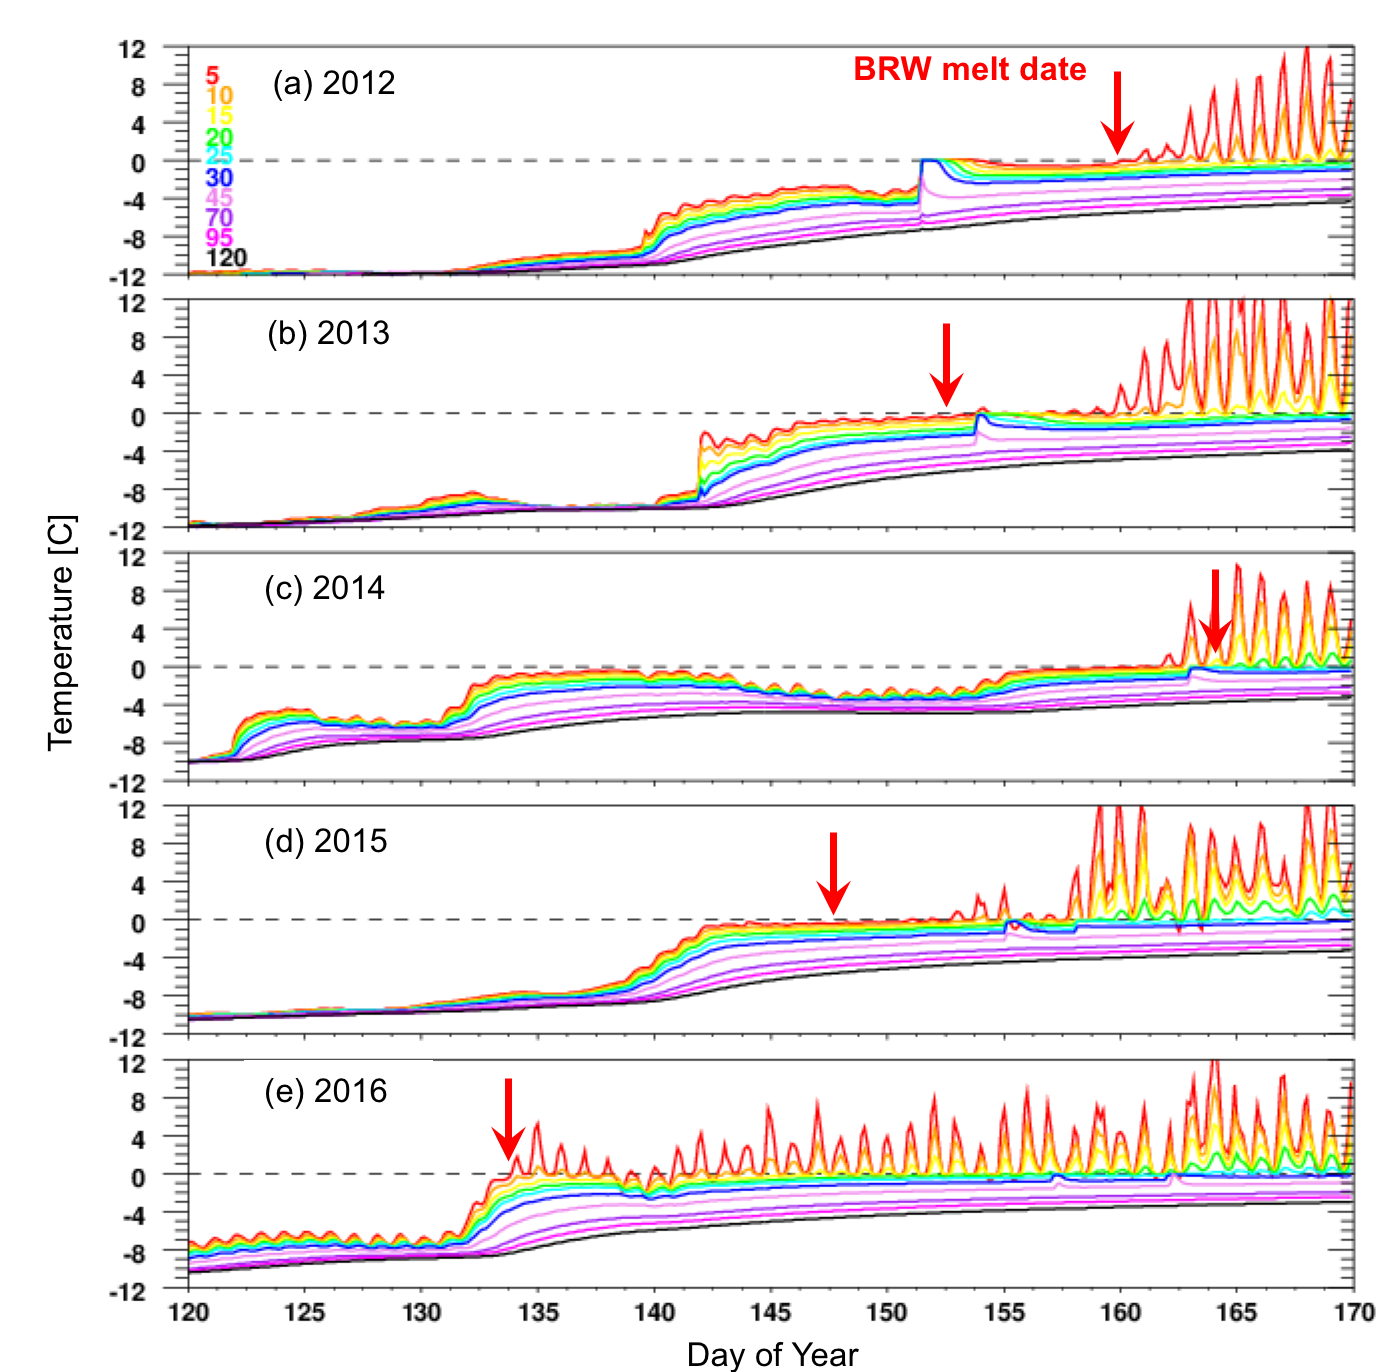
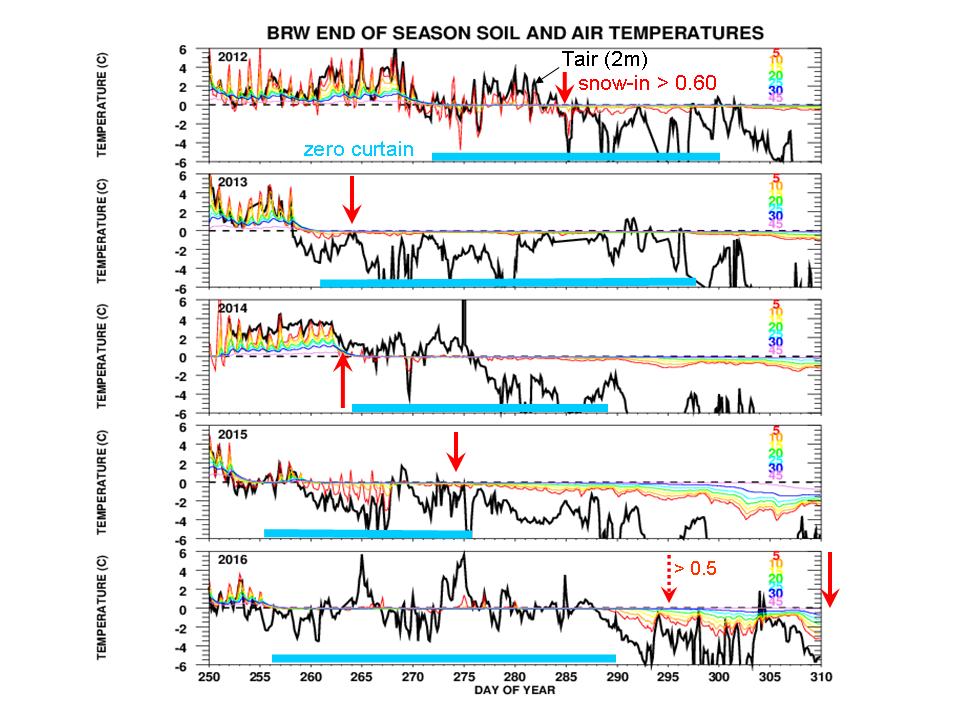
Figure 7 shows similar time series of soil temperatures at the end of the snow-free season, but only to a depth to 45 cm, which is within the active layer. There is no definitive feature of soil temperature that coincides with the date of snow-in (red arrows) at BRW. Snow-in can occur at the start, middle or end of the period denoted as zero curtain (blue bar); nor does snow-in necessarily occur when air temperature (black trace) drops below 0°C because of latent heat being released during the phase change. Thus, permafrost response to the changing snow cycle and temperature regime of northern Alaska is highly variable, involving a complicated mix of factors not fully understood.
Snow cycle impacts on biogeochemical cycles (with special thanks to C. Sweeney and G. Dutton)
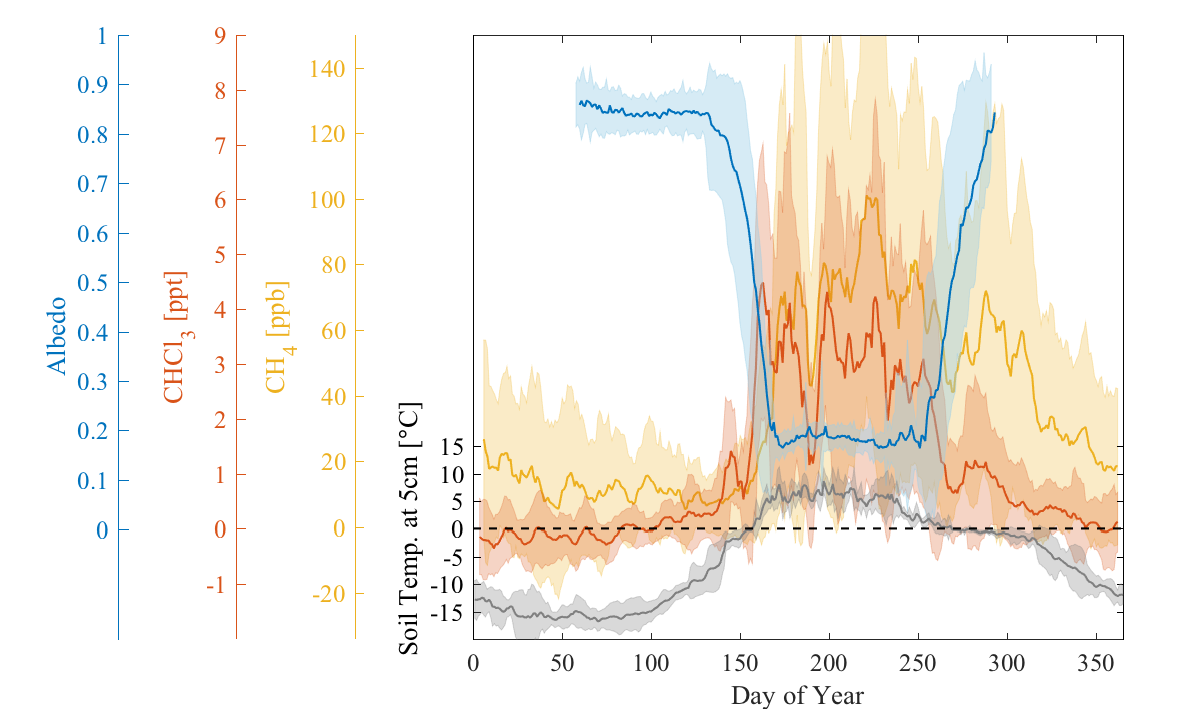
The response of biogeochemical processes to variations in the annual snow cycle at BRW depend on the chemical compound under consideration, its sources and sinks. At BRW, a variety of natural and anthropogenic gases have been monitored since the late 1970s (https://gml.noaa.gov/ccgg/index.html, https://gml.noaa.gov/hats/). Observations of methane (CH4) began in 1986 and in 1999 measurements of chloroform (CHCl3) began. Figure 8 shows the running, 7-day average seasonal cycles of enhancements of these gases above background levels. The background is determined from samples collected when winds are blowing from the northeast, between 0 and 90 degrees (Sweeney et al., 2016). Enhanced concentrations of both gases are observed during the snow-free period when winds blow from the south over tundra, between 150 and 210 degrees. The increase is coincident with the onset of snow disappearance and thawing of the permafrost (Fig. 6). Enhancements of CH4 continue after the autumn freeze-up, when the moisture-laden soils maintain a near constant temperature of 0°C (i.e., the “zero-curtain” (Fig. 7)). Microbial activity in the soil continues to produce CH4 at low temperatures and within unfrozen water (Sweeney et al., 2016; references within).
Conversely, enhancements of chloroform (CHCl3) diminish rapidly at the time of snow-in at BRW, noting that more than half of CHCl3 emissions are from natural sources, including soils. Natural emissions of CHCl3 from the tundra persist throughout the summer; however, it is not known if soil temperature or hydrology is the dominant driver of enhanced emissions. Currently, CHCl3 is useful as a biogeochemical indicator, but a better understanding of CHCl3 biogeochemistry is needed to characterize its regional role and to assess any potential implications of a longer snow-free period (Cox et al., 2017).
Ecological Responses to a Lengthening Snow-free Season (with special thanks to D. Douglas and G. Divoky)
Due to the rapid rate of Arctic warming and changing season length, wildlife as well as humans must adapt. On the North Slope of Alaska, grazers, insectivores and predators are all being challenged to maintain vitality as spatial and temporal changes affect their food supply, which in turn can be detrimental to reproduction. A few examples: some birds are migrating earlier; geese are observed to fledge fewer goslings if there is a mismatch between nesting dates and vegetation phenology; caribou calves, under the age of one month, have higher survival rates in years with earlier snowmelt, although all grazing species in the Arctic are vulnerable to rain events during winter that makes forage inaccessible (Cox et al., 2017; references therein).
Offshore, unprecedented sea ice losses have altered the seasonal habitats of marine mammals, including polar bears, walruses, whales, and ice-seals, impacting seasonal hunting conditions of residents who depend on those animals for food. Regional transportation is also impacted by the timing of the spring melt and autumn freeze-up.
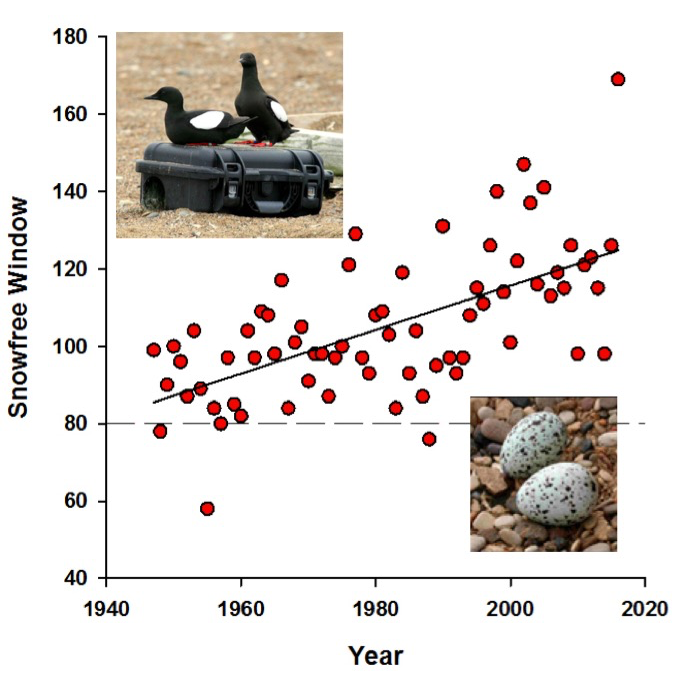
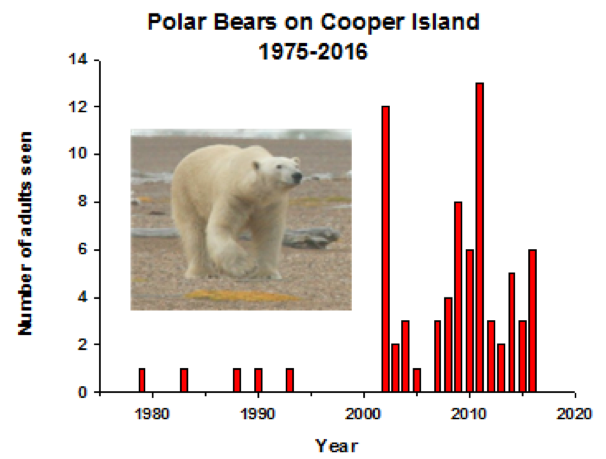
Graphic examples of how species are adapting to the changing snow and ice cycle in the vicinity of BRW are given in Figure 9 and Figure 10.
A species of bird, the Black Guillemot, breeds on shorelines adjacent to ice in summer and has been studied at Cooper Island since 1975 (Divoky et al., 2016). The species first benefitted from warming during the 20th century, but has since been negatively affected. Black Guillemots require a snow-free nest cavity for a minimum of 80 days for successful nesting, so the species was unable to colonize northern Alaska until the late 1960s when the annual snow-free period began to regularly exceed 80 days (Fig. 9). While increasing atmospheric temperatures have provided an earlier and longer breeding season for the Black Guillemots of Cooper Island, a corresponding loss of summer sea ice in the region has also occurred. The increased distance from Cooper Island to the ice pack during the period of chick rearing has reduced accessibility to their preferred ice-associated prey, Arctic Cod, resulting in starvation of chicks and low fledging weights (Divoky et al., 2015).
Less sea ice has also resulted in increased occurrences of a nest predator, the polar bear. Figure 10 shows how polar bears have become common late-summer visitors at Cooper Island since the sea ice began to retreat northward in this region of the Beaufort Sea. Predation by polar bears and a competitor, the horned puffin, have reduced Black Guillemot hatching and fledging success resulting in a decrease in their population from over 200 pairs in 1989 to 100 pairs in 2016.
Rapid warming of the Arctic ecosystem has imposed, and is likely to continue to impose, challenges and opportunities to its current and future inhabitants. Recognizing the present and likely future rates of natural and/or anthropogenic climate forcing, ecological balance in the Arctic will be many decades – possibly centuries – in the making.
Researchers at NOAA ESRL are working closely with the international community to better understand the Arctic System and the complex interactions of its various components. Interdisciplinary studies are seen as key in making strides as demonstrated by Cox et al. (2017) for BRW.
The International Arctic Systems for Observing the Atmosphere (IASOA) has formed a number of Working Groups to investigate various components of the system utilizing data from a network of Arctic stations. The organization of the network and group activities and data that have been assimilated for this purpose are described by Uttal et al., 2016 and Starkweather et al., 2016.
References
- Cox, C. J., R. S. Stone, D. C. Douglas, D. M. Stanitski, G. J. Divoky, G. S. Dutton, C. Sweeney, J. C. George; D. U. Longenecker, 2017: Drivers and environmental responses to the changing annual snow cycle of northern Alaska; Bull. Am. Meteor. Soc., doi:10.1175/BAMS-D-16-0201.1.
- Didan, K., and A. Barreto, 2016: NASA MEaSUREs Vegetation Index and Phenology (VIP) Phenology NDVI Yearly Global 0.05 Deg CMG [Data set]. NASA EOSDIS Land Processes DAAC, doi:10.5067/MEaSUREs/VIP/VIPPHEN_NDVI.004.
- Dutton, E. G. and D. J. Endres, 1991: Date of snow melt at Barrow, Alaska, USA, Arctic and Alpine Research, 23(1), p.115-119.
- Divoky, G. J., D. C. Douglas, and I. J. Stenhouse, 2016: Arctic sea ice a major determinant in Mandt's black guillemot movement and distribution during non-breeding season. Biology Letters, 12.
- Divoky, G. J., P. M. Lukacs, and M. L. Druckenmiller, 2015: Effects of recent decreases in arctic sea ice on an ice-associated marine bird. Prog. Oceanogr., 136, 151-161, doi:10.1016/j.pocean.2015.05.010.
- Foster, J. L., 1989: The significance of the date of snow disappearance on the arctic tundra as a possible indicator of climatic change, Arctic and Alpine Research, 21(1), p. 60-70.
- Foster, J. L., J. W. Winchester, and E. G. Dutton, 1992: The date of snow disappearance on the Arctic tundra as determined from satellite, meteorological station and radiometric in situ observations, IEEE Transactions on Geoscience and Remote Sensing, 30(4), 793-798.
- Starkweather, S., and T. Uttali, 2015: Cyberinfrastructure and collaboratory support for the integration of Arctic atmospheric research. Bull. Amer. Meteor. Soc., 97, 917–922, doi:10.1175/BAMS-D-14-00144.1.
- Stone, R. S., 1997: Variations in western Arctic temperatures in response to cloud radiative and synoptic-scale influences. J. Geophys. Res. Atmos., 102, 21769-21776, doi:10.1029/97JD01840.
- Stone, R., T. Mefford, E. Dutton, D. Longenecker, B. Halter and D. Endres, 1996: Surface radiation and meteorological measurements: January 1992 to December 1994. NOAA Data Report ERL-CMDL-11, 81pp.
- Stone, R. S., E. G. Dutton, J. M. Harris, and D. Longenecker, 2001: The Advancing Date of Spring Snowmelt in the Alaskan Arctic, Proceedings of the Eleventh Atmospheric Radiation Measurement (ARM) Science Team Meeting, March 19-23, 2001, Atlanta, Georgia.
- Stone, R. S., E. G. Dutton, J. M. Harris, and D. Longenecker, 2002: Earlier spring snowmelt in northern Alaska as an indicator of climate change, J. Geophys. Res., 107(D10), 4089, doi:10.1029/2000JD000286.
- Stone, R., D. Douglas, G. Belchansky, and S. Drobot, 2005: Correlated declines in Pacific Arctic snow and sea ice cover, Arctic Research of the United States, Vol. 19, pp18-25.
- Sweeney, C., E. Dlugokencky, C. Miller, S. Wofsy, A. Karion, S. Dinardo, R. Y.-W. Chang, J., Miller, L. Bruhwiler, A. Crotwell, T. Newberger, K. McKain, R. Stone, S. Wolter, P. Lang, and P. Tans, 2016: No significant increase in long-term CH4 emissions on North Slope of Alaska despite significant increase in air temperature, Geophys. Res. Lett., 43, 6604-6611, doi:10.1002/2016GL069292.
- Uttal, T., S. Starkweather, J. R. Drummond, T. Vihma, Alexander P. Makshtas, L. S. Darby, J. F. Burkhart, C. J. Cox, L. N. Schmeisser, T. Haiden, M. Maturilli, M. D. Shupe, G. de Boer, A. Saha, A. A. Grachev, S. M. Crepinsek, L. Bruhwiler, B. Goodison, B. McArthur, V. P. Walden, E. J. Dlugokencky., P. O. G. Persson, G. Lesins, T. Laurila, J. A. Ogren, R. Stone, C. N. Long, S. Sharma, A. Massling, D. D. Turner, D. M. Stanitski, E. Asmi, M. Aurela, H. Skov, K. Eleftheriadis, A. Virkkula, A. Platt, E. J. Førland, Y. Iijima, I. E. Nielsen, M. H. Bergin, L. Candlish, N. S. Zimov, S. A. Zimov, N. T. O’Neill, P. F. Fogal, R. Kivi, E. A. Konopleva-Akish, J. Verlinde, V. Y. Kustov, B. Vasel, V. M. Ivakhov, Y. Viisanen, and J. M. Intrieri (June 2016): International Arctic Systems for Observing the Atmosphere: An International Polar Year Legacy Consortium. Bull. Am. Meteor. Soc., 97(6), 1033-1056. doi:10.1175/BAMS-D-14-00145.1.
- Wendler, G., B. Moore, and K. Galloway, 2014: Strong temperature increase and shrinking sea ice in Arctic Alaska. Open Atmos. Sci. J., 8, 7-15, doi:10.2174/18742823011408010007.
Related Links
- Barrow Snowmelt Date
- Barrow Radiation Climatology
- Western Arctic Climate Change
- International Arctic Research Center
- Variations and Trends of the Pacific Arctic Climate and Environmental Response
- https://cooperisland.org/ (Friends of Cooper Island)
- https://gml.noaa.gov/ccgg/index.html (NOAA-GML Carbon Cycle Group)
- https://gml.noaa.gov/hats/ (NOAA-GML Halocarbon Group)
- http://journals.ametsoc.org/doi/citedby/10.1175/BAMS-D-14-00144.1
- http://journals.ametsoc.org/doi/abs/10.1175/BAMS-D-14-00145.1